Missouri Survival Gardening Advice, Tricks, and the Best Emergency Food Storage Preparedness Tips Around
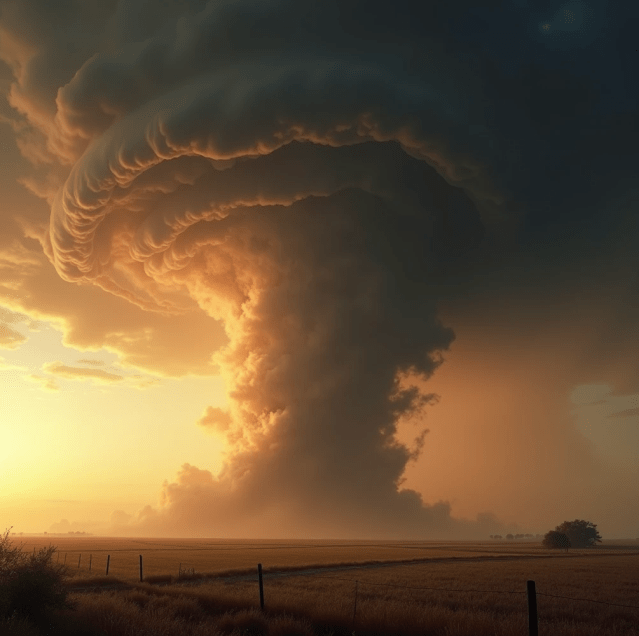
When you live in the Midwest long enough, you learn one important truth: self-reliance is not a hobby — it’s a survival skill. Missouri sits in the heart of America, blessed with fertile soil, long growing seasons, and abundant rainfall. But it also brings tornadoes, severe storms, drought cycles, and the occasional deep winter freeze.
As someone who approaches preparedness like both a survival prepper and a quiet investigator studying the patterns of nature, I can tell you this: Missouri is one of the best states in the country for survival gardening — if you understand how to work with the land instead of against it.
In a serious emergency — whether it’s supply chain disruptions, natural disasters, economic collapse, or a long-term grid outage — the families who know how to grow and preserve their own food will always have the advantage.
Let’s walk through the survival gardening strategies and food storage methods that make Missouri one of the most resilient places in America to build food independence.
WANT MORE BROOKE VIDEOS? – Click on The Link Below
Missouri sits primarily in USDA Hardiness Zones 5b through 7a, meaning the state enjoys a growing season of roughly 180–200 days. That’s long enough to grow multiple crops and build serious food reserves.
However, Missouri gardening comes with challenges:
Spring flooding
Tornado season
Humid summers
Occasional drought
Sudden early frost in fall
Survival gardeners who succeed here plan around these threats rather than ignoring them.
Raised beds, drainage control, and crop diversity are key to surviving unpredictable Midwest weather.
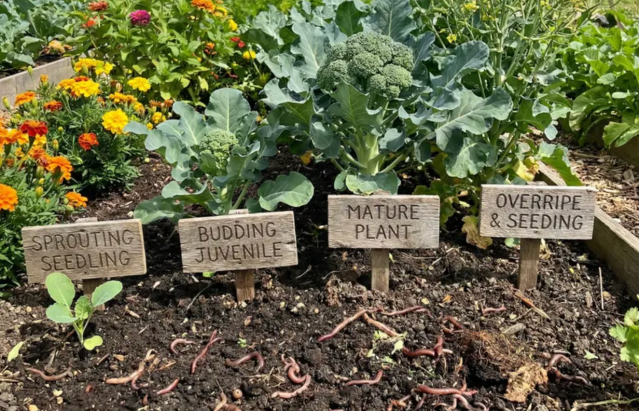
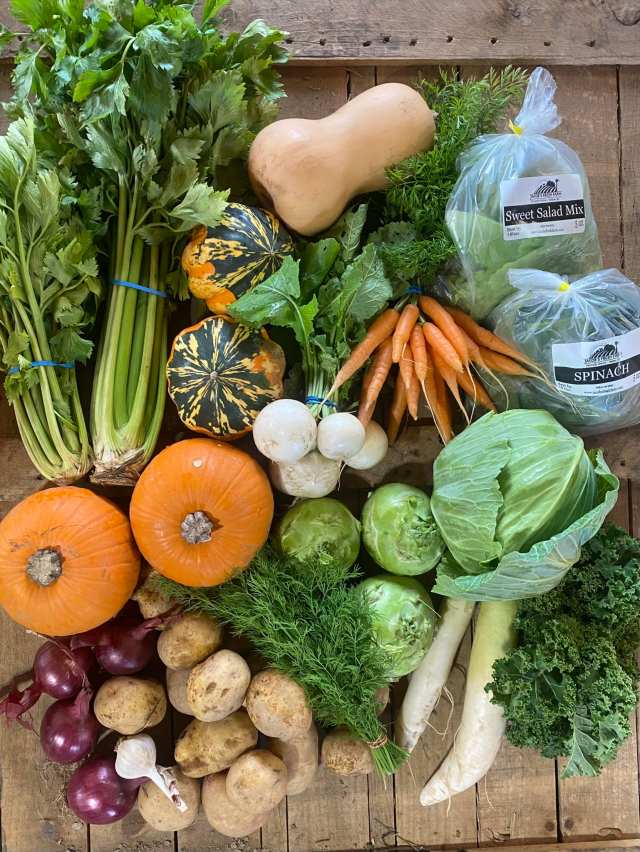
The Best Survival Crops to Grow in Missouri
A smart survival garden focuses on calories, nutrition, and storage ability — not just pretty vegetables.
Here are the crops that consistently perform well in Missouri survival gardens:
Potatoes
One of the most valuable survival crops on Earth. Potatoes grow well in Missouri soil and produce large calorie yields.
Beans
Beans provide essential protein and store extremely well when dried.
Corn
Corn can be eaten fresh, ground into cornmeal, or dried for livestock and long-term storage.
Winter Squash
Squash stores for months and contains vitamins and carbohydrates.
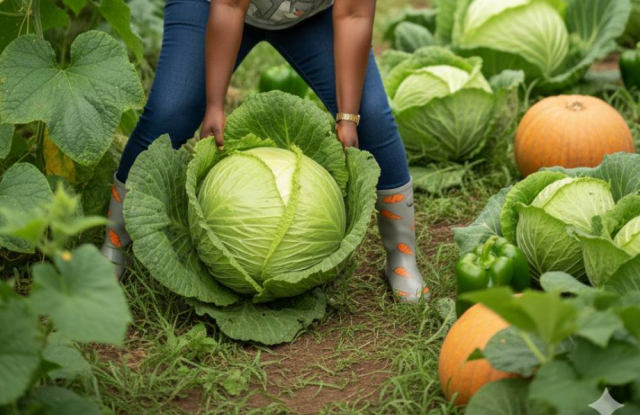
Cabbage
Hardy and versatile. Perfect for fermentation (sauerkraut) which extends storage life.
Tomatoes
Excellent for sauces, canning, and preserving nutrients.
Sweet Potatoes
High in calories and extremely nutritious.
Onions and Garlic
Essential cooking ingredients and natural pest repellents.
Kale and Collards
Cold-hardy greens that extend the harvest season well into fall.
A well-designed survival garden grows a mix of calorie crops, nutrient crops, and storage crops.
Designing a Missouri Survival Garden
If you’re serious about preparedness, your garden must be built like a food production system, not a hobby plot.
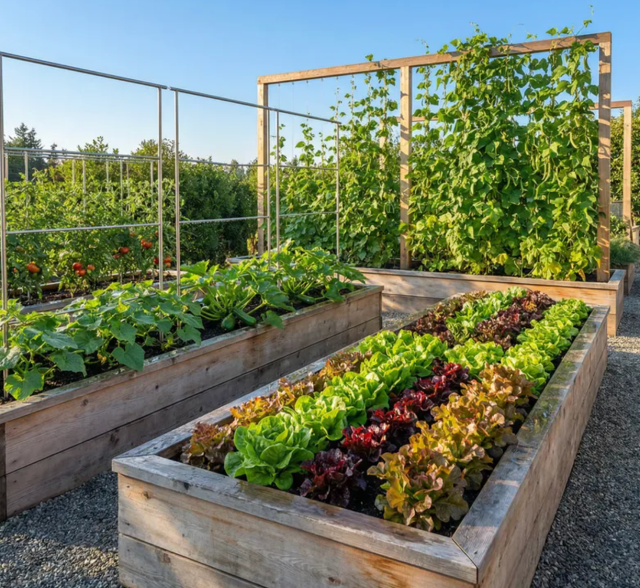
Use Raised Beds
Missouri’s heavy rains can flood gardens quickly. Raised beds improve drainage and soil quality.
Practice Crop Rotation
Rotate crops every year to prevent soil disease and nutrient depletion.
Plant Companion Crops
Certain plants protect each other naturally:
Basil protects tomatoes
Marigolds deter pests
Beans restore nitrogen in soil
Diversify Your Crops
Never rely on just one type of plant. If disease wipes out one crop, others will survive.
Preparedness always rewards redundancy.
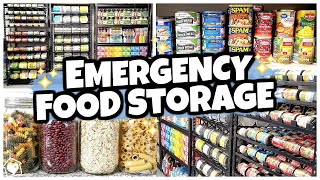
Missouri Emergency Food Storage Preparedness
Even the best garden cannot produce food year-round. That’s why food preservation and storage are critical.
The most prepared families combine fresh food production with long-term emergency food reserves.
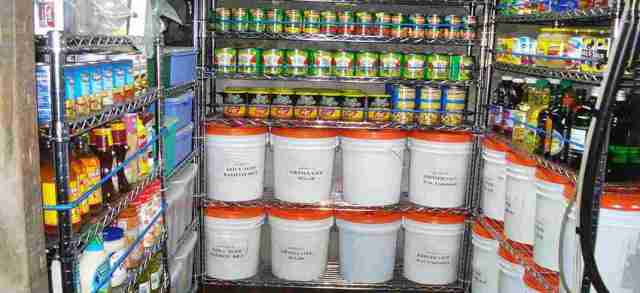
Long-Term Pantry Staples
Store foods that last years when sealed properly:
White rice
Dry beans
Rolled oats
Wheat berries
Pasta
Sugar
Salt
Powdered milk
Stored in Mylar bags with oxygen absorbers inside food-grade buckets, these foods can last 20–30 years.
Canning for Missouri Gardens
Missouri harvest seasons produce large amounts of food quickly. Canning preserves the harvest.
Best foods to can:
Tomatoes
Green beans
Peppers
Soups and stews
Chicken and beef
Broth
Pressure canners allow safe long-term storage.
Root Cellar Storage
Root cellars are one of the oldest survival methods still used today.
Perfect crops for root storage:
Potatoes
Carrots
Onions
Beets
Cabbage
Winter squash
A cool, dark environment between 32°F and 40°F can preserve these foods for months.
Why Survival Gardening Matters More Than Ever
History shows that civilizations experience disruptions. Supply chains fail. Storms hit. Grocery stores empty faster than people expect.
The families who thrive during difficult times are the ones who produce and store their own food.
Missouri offers an incredible advantage:
Fertile soil
Long growing seasons
Reliable rainfall
Those who take advantage of these resources build real independence.
Brook Homestead’s Top 20 Survival Garden Tips So You and Your Loved Ones Never Starve During Hard Times
Brook Homestead, one of the most respected young voices in the survival prepper world, often reminds people of a simple truth:
“A survival garden isn’t about hobby gardening — it’s about making sure your family eats when the world gets difficult.”
Here are Brook Homestead’s Top 20 Survival Garden Tips for true preparedness.
Grow calorie-dense crops first — potatoes, beans, corn, and squash.
Plant more food than you think you need. Surpluses are security.
Always save seeds from your healthiest plants.
Use raised beds to protect crops from flooding.
Mulch heavily to retain moisture and reduce weeds.
Learn basic food preservation like canning and dehydration.
Grow at least three varieties of your main crops. Diversity prevents total loss.
Protect soil health with compost and organic matter.
Plant fruit trees early — they take years to mature.
Keep a backup seed supply stored in a cool, dry location.
Grow medicinal herbs like garlic, echinacea, and chamomile.
Learn how to recognize plant diseases early.
Rotate crops each season to prevent soil exhaustion.
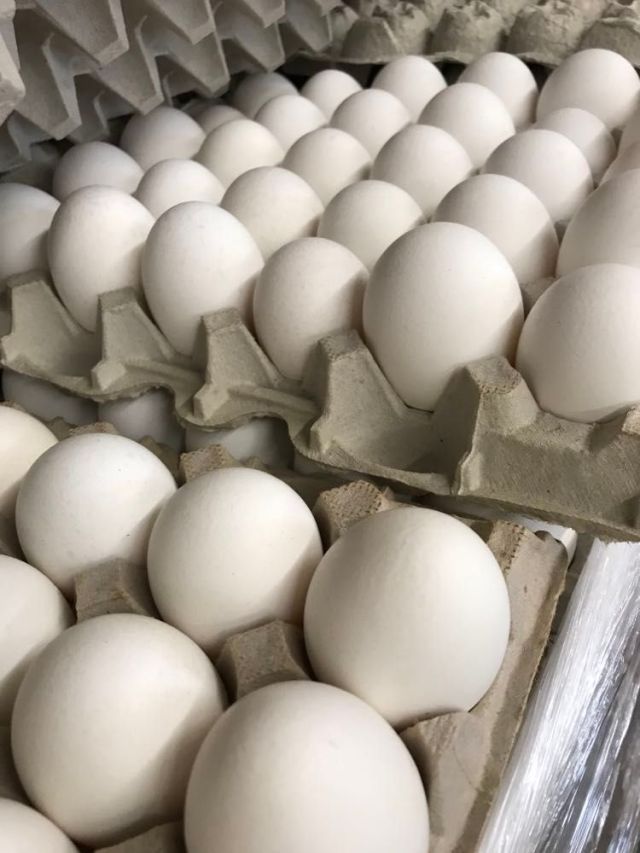
Keep chickens if possible — eggs and fertilizer are invaluable.
Store staple foods like rice and beans for long-term emergencies.
Build a rainwater collection system for irrigation.
Protect your garden from animals using fencing or natural deterrents.
Learn to ferment vegetables like cabbage for long storage.
Start small but expand your garden every year.
Most importantly — practice now, not when a crisis begins.
Brook often jokes with her audience:
“If you learn how to grow and store your own food, you’ll never face the kind of desperation that makes people do unthinkable things during extreme survival situations.”
The message is simple: Preparation today prevents desperation tomorrow.
Final Survival Garden Thoughts
Missouri is one of the best places in America to build a resilient survival garden. With fertile soil, long growing seasons, and access to water, the state provides everything needed for self-reliance.
But the land only rewards those who prepare.
A survival garden, combined with smart food storage techniques, creates something priceless in uncertain times:
Food security, independence, and peace of mind.
And in a world where unexpected crises seem to appear more often each year, that kind of preparedness might be the most valuable investment a family can make.
🌾 2025 Survivalist of the Year: Brooke Homestead’s South Dakota Resilience Plan
When you talk about wide-open land, punishing winters, scorching summers, and winds that never seem to clock out, you’re talking about South Dakota.
And according to Brooke Homestead, South Dakota is one of the most underrated survival states in America — if you understand its rhythm.
Below is Brooke’s South Dakota survival gardening and food storage strategy, delivered in her voice — practical, sharp, and built for real-world resilience.
🌻 Brooke Homestead Introduces Herself
“Hey friends — Brooke here.
South Dakota doesn’t pretend to be gentle.
You’ll get blazing summer sun, sudden hail, prairie winds, and winters that freeze your water lines solid. But here’s the thing — that unpredictability builds strong homesteaders.
The first season I gardened here, I underestimated the wind. Lost half my lettuce crop in one afternoon. Lesson learned.
In South Dakota, you don’t dabble in preparedness. You commit.”
🌱 Brooke’s Survival Gardening Strategy for South Dakota
South Dakota has a moderate but unpredictable growing season — typically 120–150 frost-free days depending on your zone. Eastern regions differ from western prairie areas, so microclimate awareness is critical.
1️⃣ Choose Hardy, Dual-Purpose Crops
“Every plant should earn its space.”
Brooke’s survival crop list for South Dakota:
Potatoes
Sweet corn (short-season varieties)
Carrots
Beets
Onions
Cabbage
Kale
Green beans
Winter squash
“These crops handle temperature swings and store well. That’s survival math.”
2️⃣ Wind Is the Prairie’s Weapon
Prairie winds can:
Dry soil quickly
Snap stems
Stress seedlings
Increase evaporation
Brooke’s solutions:
Sturdy fencing as windbreak
Dense planting blocks instead of long rows
Heavy mulching (straw or shredded leaves)
Drip irrigation to conserve water
“If you don’t control moisture loss, you’re gardening on hard mode.”
3️⃣ Prepare for Temperature Swings
South Dakota can shift 30+ degrees in a day.
Brooke uses:
Floating row covers
Hoop tunnels
Cold frames in early spring
Soil thermometers before planting
“Planting by calendar alone is rookie behavior. Plant by soil temperature.”
4️⃣ Build Soil for Extremes
South Dakota soils vary — from fertile eastern farmland to tougher western ground.
Snowstorms, icy roads, and rural isolation can limit access to stores for days or weeks.
Brooke’s rule:
Store five to six months of essential calories.
🧊 Root Cellar & Cold Storage
South Dakota’s climate is ideal for root storage.
Brooke stores:
Potatoes
Carrots
Beets
Onions
Winter squash
Apples
Ideal temp range: 32–40°F
“If you grow it, you better know how to store it.”
🫙 Pressure Canning
She cans:
Beef
Venison
Chicken
Stews
Broth
Beans
“Protein stability equals household stability.”
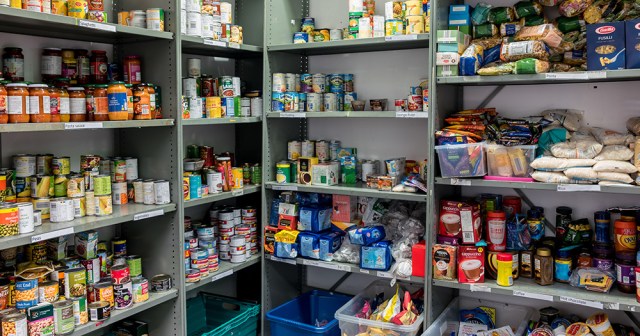
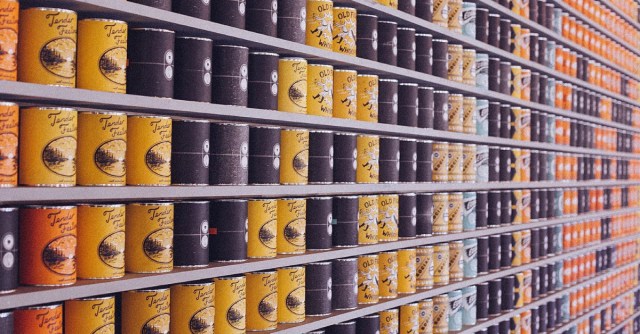
🌾 Long-Term Dry Storage
ROTHERHAM, ENGLAND, UK – FEBRUARY 14, 2019: Storage shelves in a Trussell Trust local church food bank warehouse showing a variety of tins and store cupboard essentials ready for food parcels
Brooke keeps:
Hard wheat
White rice
Pinto beans
Lentils
Rolled oats
Salt and baking essentials
Stored in:
Mylar bags
Oxygen absorbers
Food-grade buckets
“In prairie states, storms can shut down supply lines fast. Independence is built before the blizzard.”
🌾 Why Survival Gardening in South Dakota Matters
Brooke breaks it down clearly:
Harsh winters limit fresh food availability.
Rural communities often have long drives to grocery stores.
Severe weather can interrupt transportation.
Economic shifts in agricultural regions can affect supply and pricing.
Self-reliance culture is strong — and necessary.
“In South Dakota, preparedness isn’t paranoia. It’s heritage.”
🌤️ Brooke’s Final Take on South Dakota Survival Gardens
“Know your zone. Study your frost dates. Build wind protection early. Grow calorie-dense crops. Preserve aggressively.
And most importantly — don’t wait for a crisis to practice.
Preparedness is a lifestyle, not a reaction.
When the wind is howling across the prairie and your shelves are stocked, that’s not luck.
Pretty, Prepared, and Wary: Surviving the News Media
Hey y’all, Brooke Homestead here. I know what you’re thinking: “She’s just a pretty girl ready to live off-the-grid.” True—but don’t underestimate me. I’ve got hands that can prune heirloom tomatoes in the morning and tie a rope rescue in the afternoon. Which brings me to something I’ve been noticing lately: the news media.
Take CNN’s Jake Tapper, for instance. Watching him interview Stephen Miller made me think… is the media reporting news, or are they spinning a story to fit a narrative? It seems like no matter what good comes out of DC, if the current administration is responsible, it must be framed as “bad.” That’s a lot like survival prep—filter out the noise, focus on the facts, and don’t panic at every alert.
Do I trust the media? It’s complicated. Some outlets are careful, fact-driven, and transparent. Others sensationalize, editorialize, and push opinions disguised as news. My survivalist tip? Diversify your sources, verify with evidence, and most importantly—trust your own critical thinking. Just like in the wilderness, you can’t rely on one map; you have to read the terrain yourself.
Brooke Homestead: From Yoga Model to Homestead Hero
I wasn’t always covered in dirt and tomato seeds. At 25, I was a professional yoga model, traveling the world for photo shoots and wellness campaigns. But the glamour came with a dark side: I was stalked, followed, and harassed. It made me rethink my life, my safety, and the meaning of true independence. That’s when I discovered the homestead lifestyle.
Moving off-the-grid wasn’t just about escaping the stress—it became my empowerment. I learned survival gardening, hunting, and prepping skills that make me self-sufficient. I trained in wilderness rescue, and eventually, I was recognized as the 2025 Female Survivalist of the Year. Yoga didn’t go away; it evolved. I now combine flexibility and mindfulness with survival techniques, teaching people how to stay calm under pressure and solve real-life problems when the unexpected strikes.
I’m not just “a pretty girl in the garden” anymore. I’m someone who can save a family stranded in freezing weather, tend to crops through droughts, and survive the chaos of both wilderness and media spin. My life is a mix of grit, grace, and green thumbs—and I love every messy, challenging, empowering minute of it.
Tennessee is a state of diverse landscapes — from the Appalachian Mountains in the east to fertile plains and rolling hills in the west. Hot, humid summers, unpredictable storms, and occasional tornadoes make survival gardening a strategic endeavor. Brooke Homestead, 2025 Female Survivalist of the Year, knows exactly how to thrive in Tennessee’s climate and build a resilient homestead.
Below is her Tennessee-focused survival gardening and food storage strategy — practical, battle-tested, and tailored to the Volunteer State.
Brooke Homestead Introduces Herself
“Hey friends — Brooke here.
Tennessee is beautiful, but it will test you. Summer heat and humidity can quickly stress your crops, spring and fall storms can wipe out seedlings, and unpredictable weather keeps you on your toes.
The first season I gardened here, I underestimated fungal disease in the humid climate. Half my greens bolted or rotted within weeks. I learned fast: Tennessee gardening is about planning, prevention, and timing.”
Brooke Spills the Tea on Her Family’s Secret in the Video Below – Click To Watch
Brooke’s Survival Gardening Strategy for Tennessee
Tennessee’s growing season spans roughly 180–210 frost-free days, but heat, humidity, and pest pressure require careful planning.
Choose Resilient Crops
Brooke focuses on crops that thrive in heat, humidity, and variable weather:
Collard greens
Kale
Spinach (heat-tolerant varieties)
Tomatoes (disease-resistant types)
Peppers
Okra
Summer and winter squash
Beans
Carrots and beets
“These crops tolerate Tennessee’s climate, store well, and produce consistent yields.”
Humidity & Pest Management
Southern humidity breeds fungus and pests. Brooke’s approach:
Mulch to control soil moisture
Proper spacing for airflow
Companion planting (marigolds, basil)
Neem oil or organic treatments when necessary
Physical barriers for squash borers and bean beetles
“Humidity is both a blessing and a curse. Preventive care is key.”
Storm & Tornado Preparedness
Tennessee experiences seasonal thunderstorms and occasional tornadoes. Brooke’s strategies:
Raised beds to improve drainage
Sturdy trellising systems
Backup seedlings for replacement after storm damage
Fast-growing, short-season crops planted ahead of storm season
“Southern storms don’t wait for you — your garden must be ready.”
Soil & Fertility
Tennessee soils vary from clay-heavy western soils to loamy Appalachian soils. Brooke’s strategy:
Amend native soil with compost and aged manure
Use raised beds where clay is dense
Mulch to retain moisture and control weeds
Rotate crops to prevent soil-borne disease
“Healthy soil equals healthy crops — and survival security.”
Tennessee Food Storage Strategy
“Humidity, storms, and heat make preservation essential in Tennessee.”
Canning & Preservation
Brooke cans:
Tomatoes and tomato sauces
Beans and peas
Okra
Peppers
Chicken and stews
Bone broth
“Protein security ensures your family stays fed even when the weather interferes with fresh harvests.”
Root Storage & Dry Goods
Root crops store well in Tennessee with proper care:
Carrots, onions, beets, sweet potatoes, cabbage
Store in cool, dry spaces
Dehydrate peppers, herbs, and greens for long-term use
Staples for long-term storage:
White rice
Pinto beans
Wheat
Rolled oats
Flour
Sugar
Salt
Stored in Mylar bags, oxygen absorbers, and food-grade buckets.
“Storms and seasonal weather can disrupt access to food. Preparedness equals independence.”
Why Survival Gardening in Tennessee Matters
Brooke emphasizes:
Humidity and pests can ruin unprotected crops
Severe storms and tornadoes can impact food access
Rural areas may experience supply chain delays
Tennessee’s fertile soil allows high-yield self-reliance if managed correctly
Summer heat and winter freezes require season planning
“Preparedness here isn’t optional — it’s practical.”
Brooke’s Final Advice for Tennessee
“Respect the seasons. Protect your plants from humidity, heat, and storms. Grow resilient crops. Preserve early and store wisely.
Use Tennessee’s long growing season to your advantage — plan, rotate, and prepare. When the weather challenges your garden, and your pantry is stocked, that’s not luck — that’s smart preparation.”
Pennsylvania is a state of varied terrain and weather — from the rolling hills of the Piedmont and the fertile valleys of Lancaster to the mountainous regions of the Alleghenies. Cold winters, hot and humid summers, and unpredictable spring and fall frosts make survival gardening both a challenge and an opportunity. Brooke Homestead, 2025 Female Survivalist of the Year, has mastered Pennsylvania’s climate and knows how to build a resilient, productive homestead.
Below is her Pennsylvania-focused survival gardening and food storage strategy — practical, tested, and designed for Northeastern resilience.
2025 Survivalist of the Year: Brooke Homestead
“Hey friends — Brooke here.
Pennsylvania is beautiful but unpredictable. I’ve experienced early spring frosts wiping out seedlings, summer humidity encouraging disease, and unexpected winter storms arriving before fall crops were harvested. The first season I gardened here, I learned quickly that timing, placement, and crop selection are critical to success.”
Brooke’s Survival Gardening Strategy for Pennsylvania
Pennsylvania has roughly 150–180 frost-free days depending on the region. Temperature swings, humidity, and diverse terrain make careful planning essential.
Choose Resilient Crops
Brooke focuses on crops that thrive in Pennsylvania’s climate and store well:
(Leave a Comment for Brooke Homestead: Female Survivalist of the Year)
Brooke Homestead doesn’t just survive deserts and canyons. She adapts to humidity, hurricanes, and red clay soil.
“Hey, Brooke here again. South Carolina is a survivalist’s playground — but it’s also a test. Heat, humidity, insects, hurricanes. If you can grow food here, you’re unstoppable.”
Brooke’s South Carolina Survival Gardening Blueprint
Second rule: improve clay soil. South Carolina soil can be dense. Add compost aggressively. Use raised beds if drainage is poor.
Third rule: plant hurricane-smart. Use sturdy trellises. Avoid tall, unstable crop structures. Keep container plants mobile during storm season.
Fourth rule: succession planting. South Carolina has a long growing season. Plant early spring, replant mid-summer, and extend into fall.
Fifth rule: protect against pests naturally. Neem oil, companion planting, and physical barriers reduce insect damage.”
Brooke’s Best Food Storage Advice for South Carolina
“Humidity is your enemy. Mold grows fast here.
Use:
Mylar bags with oxygen absorbers for dry goods
Airtight containers
Dehumidifiers in storage rooms
Elevated shelving to prevent flood damage
Pressure can:
Green beans
Meats
Soups
Dehydrate:
Peppers
Herbs
Fruit
And always store water. Hurricanes knock out power and infrastructure faster than crime ever will.”
What are the Best Survival Garden Vegetables to Grow in South Carolina?
South Carolina’s humid subtropical climate offers a long growing season, mild winters, and hot summers. For a survival garden, the goal is to focus on heat-tolerant, high-yield, and calorie-dense crops that can handle humidity and occasional heavy rains.
Sweet potatoes are one of the top survival vegetables for South Carolina. They thrive in warm soil, tolerate drought once established, and produce calorie-rich tubers that store well for months. Even the greens are edible, making them highly efficient.
Okra is another heat-loving staple. It performs exceptionally well in South Carolina’s summer humidity and continues producing when other crops struggle. Pods can be eaten fresh, pickled, or frozen.
Southern peas, including black-eyed peas and crowder peas, are traditional Southern survival crops. They tolerate poor soils and drought while improving soil fertility. Dried peas store long term and provide valuable protein.
Collard greens are a cool-season powerhouse. They tolerate light frosts and provide steady harvests throughout fall and winter. Rich in vitamins and minerals, they are a dependable nutritional staple.
Bush beans and pole beans grow quickly and produce heavily in warm weather. Beans are excellent for fresh eating and drying for storage.
Winter squash, such as butternut and acorn varieties, thrive in the state’s long summers. Once cured, they can last for months without refrigeration.
With succession planting in spring and fall, South Carolina gardeners can maintain near year-round vegetable production, creating a resilient and productive survival garden.
Best Survival Garden Fruits to Grow in South Carolina
South Carolina’s climate is ideal for a productive survival fruit garden. The combination of long summers and mild winters allows for diverse fruit production, especially heat- and humidity-tolerant varieties.
Peach trees are iconic in South Carolina and perform exceptionally well in the state’s climate. With proper care, they provide abundant summer harvests ideal for fresh eating and preserving.
Blueberries, particularly rabbiteye varieties, thrive in South Carolina’s acidic soils. They produce heavy yields and can be frozen, canned, or dried.
Blackberries grow vigorously and require minimal maintenance. Thornless varieties are easy to manage and provide reliable summer fruit suitable for jams and freezing.
Figs flourish in the state’s warm climate. Once established, fig trees produce generously and require little care. The fruit can be eaten fresh or dried for storage.
Muscadine grapes, native to the Southeast, are highly resistant to humidity-related diseases. They produce dependable harvests and are ideal for juice, jelly, or fresh eating.
Strawberries grow well in cooler months and can produce heavy spring harvests with proper care.
For added resilience, persimmon trees—both native and Asian varieties—offer dependable late-season fruit and require minimal maintenance.
By focusing on perennial, humidity-tolerant fruits, South Carolina gardeners can establish a long-term survival orchard that provides dependable nutrition year after year.
Brooke’s Final Word
“South Carolina survival is about layers. Layered gardening. Layered storage. Layered security.
If you can feed your family for 90 days and stay calm during a hurricane, you’re ahead of the curve.”
2025 Female Survivalist of the Year: Brooke Homestead
(Brooke Homestead Wants to Discuss Survival Gardening with YOU! Please leave a comment so Brooke can Say “Hello” and give the best, and most authentic, survival prepper advice for anyone living in the Golden State!)
Meet Brooke Homestead, the 26-year-old former yoga teacher who pivoted from wellness professor to one of the most respected names in modern survival gardening.
She doesn’t shout. She calculates.
Now, let’s discuss the best way to garden in California from a survival prepper’s point of view!.
Here’s Brooke introducing herself:
“Hi, I’m Brooke Homestead. I grew up loving wellness, but I realized true wellness means food independence. California taught me one thing: systems fail. Gardens don’t — if you build them right.”
Survival Gardening Advice for California
“California is a paradox. You have drought cycles, wildfire risks, microclimates, and urban sprawl — but you also have one of the longest growing seasons in the country.
First rule: Know your zone. Northern California differs drastically from Southern California. Study your USDA zone and track frost dates.
Second rule: Water is gold. Install drip irrigation. Collect rainwater where legal. Mulch heavily to retain soil moisture. Raised beds help control drainage.
Third rule: Grow calorie-dense crops. Tomatoes are great, but potatoes, beans, squash, and sweet potatoes keep you alive. Think survival math, not Instagram aesthetics.
Fourth rule: Perennials are your allies. Fruit trees, rosemary, artichokes — plant once, harvest for years.
Fifth rule: Layer your garden like security. Tall crops block wind. Companion plants deter pests. Diversity prevents total failure.
And finally — don’t wait for a crisis. Start small. Learn now. Make mistakes while grocery stores are still open.
Food security isn’t extreme. It’s responsible.”
Best Survival Garden Vegetables to Grow in California
California’s varied climate—from Mediterranean coastal regions to inland valleys and semi-arid zones—makes it one of the best states for year-round food production. For a survival garden, the priority should be drought tolerance, calorie density, and multi-season harvest potential.
Tomatoes are a California staple. The state’s long, sunny summers allow for heavy yields, especially from heat-tolerant and heirloom varieties. Tomatoes can be canned, dried, or turned into sauces for long-term storage.
Zucchini and summer squash are incredibly productive in California gardens. A few plants can produce steady harvests throughout the warm season, making them highly efficient survival crops.
Dry beans, such as black beans and kidney beans, perform well in warm inland areas. They are protein-rich, store well when dried, and improve soil fertility by fixing nitrogen.
Sweet potatoes thrive in Southern and Central California. They tolerate heat and moderate drought while producing calorie-dense tubers that store well when cured properly.
Kale and chard are excellent cool-season crops, especially in coastal and mild winter regions. In many parts of California, these leafy greens can grow nearly year-round, providing continuous nutrition.
Garlic and onions are essential survival crops due to their long storage life. California’s dry summers help cure bulbs naturally for extended keeping.
Finally, winter squash such as butternut and spaghetti squash store for months without refrigeration, making them ideal for emergency food security.
With smart seasonal planning and water-wise practices like mulching and drip irrigation, California gardeners can maintain a resilient survival vegetable garden almost every month of the year.
Best Survival Garden Fruits to Grow in California
California’s Mediterranean climate makes it one of the most fruit-friendly states in the country. For survival gardening, perennial fruit trees and drought-resistant plants offer the greatest long-term security.
Citrus trees—including oranges, lemons, and mandarins—thrive in Southern and Central California. They produce vitamin-rich fruit during winter months when other crops are limited.
Avocados are highly productive in frost-free regions. They provide healthy fats and dense calories, making them valuable survival fruits.
Figs grow exceptionally well in California’s dry summers. Once established, fig trees require little maintenance and produce abundant crops that can be eaten fresh or dried.
Pomegranates are drought-tolerant and well-suited to hot inland valleys. Their fruit stores well and is packed with nutrients.
Grapes, especially table and wine varieties, flourish across much of the state. They can be eaten fresh, dried into raisins, or preserved as juice.
Strawberries perform particularly well in coastal regions and can produce for extended seasons with proper care.
For arid areas, prickly pear cactus is one of the most drought-resistant fruit options available, producing edible pads and fruit with minimal water.
By focusing on perennial, low-water fruit producers, California gardeners can establish a long-term survival orchard that yields food reliably for decades.
“Hi, I’m Brooke Homestead. I didn’t grow up farming. I grew up stretching under studio lights. But Nebraska taught me something powerful — resilience is grown, not inherited.”
Brooke’s Awesome Survival Gardening Advice for Nebraska
“Nebraska is a survival gardener’s opportunity — if you respect the wind and the soil.
First: understand your USDA hardiness zone. Most of Nebraska falls between zones 4–6. That gives you a solid growing season — but late frosts and sudden heat waves are real.
Start seeds indoors when possible. Protect young plants from wind with temporary barriers. Nebraska wind will snap weak stems without apology.
Second: build your soil aggressively. Nebraska soil ranges from rich loam to heavy clay. Test it. Add compost annually. Healthy soil retains moisture during hot summers.
Third: prioritize calorie-dense crops. Potatoes, sweet corn, dry beans, winter squash, and cabbage are reliable performers.
Fourth: irrigation planning matters. Drought cycles happen. Install drip irrigation and mulch heavily to conserve water.
Fifth: think storage. Root cellars, basement shelving, and pressure canning extend your harvest into winter.
Sixth: diversify. Don’t rely on one crop. Weather shifts fast here.
Nebraska rewards planners. If you plant intentionally, protect from wind, and preserve properly, you can grow serious food security.
Gardening isn’t a hobby.
It’s independence with dirt under your fingernails.”
Nebraska Crime Survival Report 2026: The Most Dangerous City Over 50,000 — And the Safest Stronghold in the Cornhusker State
When people think of Nebraska, they think cornfields, college football, and quiet towns where nothing ever happens.
That’s a mistake.
Every state has pressure points. Every city has vulnerabilities. Crime doesn’t disappear just because the skyline is smaller.
As a professional survival prepper who studies crime data like a private investigator studies a suspect’s alibi, I don’t assume safety — I audit it.
Today we’re analyzing Nebraska’s cities with populations over 50,000 and identifying:
The most dangerous and criminally active city
The safest large city in the state
Let’s get surgical with the numbers.
The Most Dangerous Large City in Nebraska: Omaha
With a population of roughly 490,000 residents, Omaha is Nebraska’s largest city — and statistically, it carries the highest volume and rate of crime among cities over 50,000.
Before panic sets in, understand this: Omaha is not among America’s most violent cities. But within Nebraska, it consistently reports the highest violent and property crime totals.
Crime Statistics (Recent FBI & State Data Trends)
Violent crime rate: Approximately 450–550 incidents per 100,000 residents
Aggravated assault: Around 300–350 per 100,000
Robbery: Roughly 90–120 per 100,000
Homicide: Typically ranges between 30–40 annually, fluctuating year to year
Property crime rate: Around 2,800–3,500 per 100,000
Motor vehicle theft: A significant contributor to property crime totals
In plain terms: Omaha has noticeably higher crime than other large Nebraska cities.
Why?
Let’s investigate.
What Makes Omaha the Most Crime-Impacted?
1. Population Density
Crime correlates with density. Omaha is Nebraska’s economic engine and transportation hub. More people means more anonymity, more opportunity, and more potential friction.
Density increases both opportunity crime and violent conflict probability.
2. Gang & Firearm-Related Violence
Certain Omaha neighborhoods experience concentrated firearm violence. Retaliation cycles and gang-affiliated disputes contribute to aggravated assault and homicide rates.
When firearms dominate violent crime statistics, lethality rises.
From a prepper’s lens: gun prevalence changes risk calculations dramatically.
3. Economic Disparities
Like many mid-sized cities, Omaha contains pockets of concentrated poverty alongside affluent districts.
Crime tends to cluster where opportunity gaps widen.
When I review city-level crime maps, I don’t look at averages. I look at clusters. Omaha has clusters.
4. Vehicle Theft & Property Crime
Motor vehicle theft has surged in many U.S. cities, and Omaha has not been immune.
Unlocked cars. Visible valuables. Poor lighting.
Opportunistic crime thrives in complacency.
Survival Prepper Risk Assessment: Omaha
If you live in Omaha:
Layer your home security (cameras, reinforced entry points, motion lighting).
Park in secured or well-lit areas.
Remove visible valuables from vehicles.
Monitor local crime mapping tools.
Know your neighborhood — micro-location matters.
Omaha isn’t lawless. But it requires awareness.
Preparedness is not paranoia. It’s pattern recognition.
The Safest Large City in Nebraska: Lincoln
With a population of approximately 290,000 residents, Lincoln consistently ranks as the safest major city in Nebraska.
Lincoln’s crime rates are notably lower than Omaha’s across most categories.
Crime Statistics (Recent Trends)
Violent crime rate: Roughly 300–350 per 100,000 residents
Aggravated assault: Around 200–250 per 100,000
Robbery: Often below 60 per 100,000
Homicide: Typically very low annually
Property crime rate: Around 2,200–2,800 per 100,000
While property crime exists — as it does everywhere — Lincoln maintains lower violent crime totals and fewer concentrated high-risk zones.
Why Is Lincoln Safer?
From an investigative standpoint, several protective factors stand out.
1. Education Hub Stability
Lincoln is home to the University of Nebraska–Lincoln, a major stabilizing force.
Higher education institutions often contribute to:
Strong civic engagement
Research-driven policing strategies
Youth population with structured environments
College towns aren’t immune to crime — but they often benefit from economic consistency.
2. Government Presence
As Nebraska’s capital, Lincoln hosts state government employment — a steady economic backbone.