

Ladies and gentlemen, grab your flashlight and your sense of humor — we’re heading into the Natural State.
Today, we’re investigating two Arkansas cities with populations over 100,000:
- The most dangerous and criminally active
- The safest among the large cities
No fear-mongering. No drama. Just facts, context, and a little wit from your friendly neighborhood survival-prepper-who-reads-crime-data-for-fun.
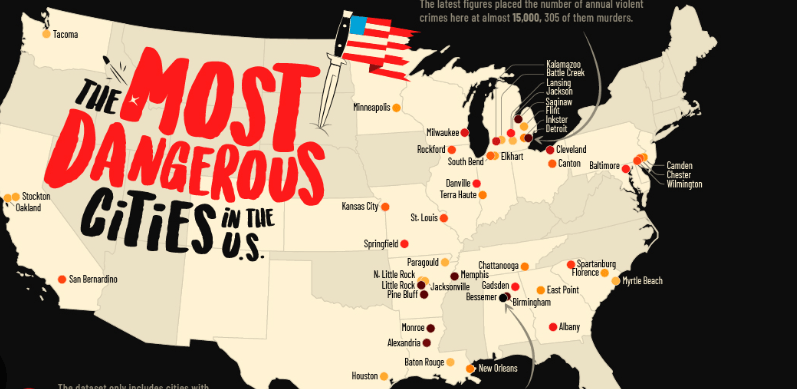
🟥 The Most Dangerous Large City in Arkansas: Little Rock
Little Rock
Population: ~203,000
When it comes to Arkansas cities with over 100,000 residents, Little Rock consistently reports the highest violent crime rates.
📊 Crime Snapshot (Recent FBI Uniform Crime Reporting Data)
- Violent crime rate: ~1,500–1,800 per 100,000 residents
- Homicide rate: Frequently above 20 per 100,000 in peak years
- Property crime rate: ~4,000+ per 100,000
For context, the national violent crime average typically sits around 380–400 per 100,000. That means Little Rock’s violent crime rate can run roughly 4x the national average.
That’s not “lock yourself in a bunker” territory — but it’s definitely “be aware of your surroundings and don’t leave your truck unlocked with a bass boat attached.”
🔎 What Makes Little Rock More Crime-Prone?
Now let’s think like investigators, not alarmists.
1. Concentrated Poverty Pockets
Like many mid-sized Southern capitals, Little Rock has neighborhoods with high poverty and limited economic mobility — a common correlation with elevated violent crime.
2. Gang Activity
Local law enforcement has repeatedly cited gang-related violence as a contributor to homicide spikes.
3. Drug Trafficking Corridors
Arkansas sits near major interstate transport routes. Narcotics distribution plays a role in crime patterns, especially firearm-related offenses.
4. Urban Density Effect
When you put 200,000 people close together, statistically… things happen. More interactions = more conflict potential.
🇺🇸 Where Does Little Rock Rank Nationally?
Based on recent national crime comparisons for cities over 100,000 residents:
- Little Rock often ranks between #20 and #35 in the Top 50 Most Dangerous U.S. Cities (violent crime rate basis).
It does not typically land in the Top 10, but it regularly places within the Top 50.
That’s serious — but not Detroit-in-1990 serious.
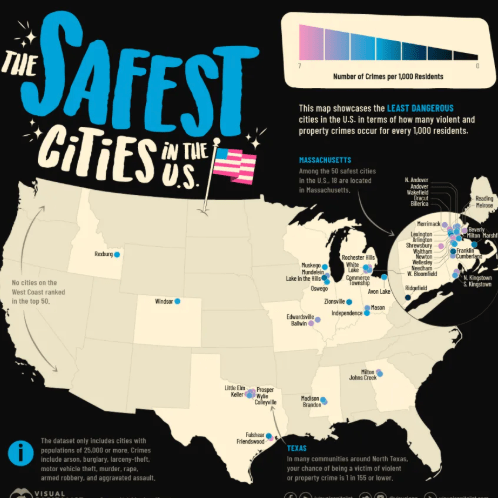
🟩 The Safest Large City in Arkansas (100,000+): Fayetteville
Fayetteville
Population: ~100,000+
Fayetteville clears the 100,000 threshold and consistently posts the lowest violent crime rate among Arkansas cities of that size.
📊 Crime Snapshot
- Violent crime rate: ~250–350 per 100,000
- Property crime rate: ~2,000–2,500 per 100,000
- Homicide rate: Typically very low, often single digits annually
That violent crime rate is at or below the national average.
🔐 What Makes Fayetteville Safer?
Time to put the detective hat back on.
1. University Effect
Fayetteville is home to University of Arkansas.
College towns often have:
- Higher education levels
- More police presence
- Younger demographic
- Strong community engagement
2. Economic Stability
Northwest Arkansas has seen major corporate expansion due to proximity to:
- Walmart (headquartered in Bentonville)
- Tyson Foods
Higher median income correlates with lower violent crime.
3. Urban Planning & Growth
Fayetteville has invested in infrastructure, walkability, and community programs.
Translation: people feel invested in their city.
🇺🇸 Where Does Fayetteville Rank Nationally?
Among cities over 100,000 residents:
- Fayetteville does not typically crack the Top 50 Safest Cities nationwide, because many suburban cities post ultra-low rates.
- However, it generally ranks in the top 30–40% safest mid-sized cities in the U.S.
It’s not “Mayberry,” but it’s solidly stable.
🗺️ Where Does Arkansas Rank Among U.S. States for Safety?
Arkansas
Arkansas generally ranks between:
- #40 and #45 out of 50 states for overall safety (violent crime rate basis).
Why?
- Elevated violent crime rates in urban areas
- Above-average homicide rate statewide
- Property crime slightly above national average
But here’s the nuance:
Arkansas has large rural areas with extremely low crime. The statewide ranking is pulled upward by concentrated urban violence.
It’s not chaos. It’s uneven distribution.
🏛️ Political Representation Since 1990: Democrats vs Republicans in Arkansas
Now let’s examine leadership history — strictly by numbers.
🟦 Democrats Since 1990
U.S. Senate
Since 1990, Democrats held Arkansas Senate seats until 2015.
Notable:
- Blanche Lincoln
- Mark Pryor
Total Democratic U.S. Senators since 1990: 2
U.S. House of Representatives
From 1990 to roughly 2010, Democrats held multiple House seats.
Since 2014, all Arkansas House seats have been Republican.
Estimated total Democratic House members since 1990: At least 6 different individuals.
Democratic Governors Since 1990
- Bill Clinton (Governor until 1992)
- Jim Guy Tucker
- Mike Beebe
Democratic Governors since 1990: 3
🟥 Republicans Since 1990
U.S. Senate
Since 2015, both Senate seats have been Republican:
- Tom Cotton
- John Boozman
Republican U.S. Senators since 1990: 2
U.S. House
As of mid-2010s onward:
All 4 House seats are Republican.
Total Republican House members since 1990: Approximately 6+ individuals, mostly in recent years.
Republican Governors Since 1990
- Mike Huckabee
- Asa Hutchinson
- Sarah Huckabee Sanders
Republican Governors since 1990: 3
So… Does Politics Explain Crime?
Here’s the prepper truth:
Crime trends are influenced by:
- Poverty
- Education levels
- Policing strategy
- Urban density
- Drug markets
- Economic opportunity
They are not solely dictated by party control.
Arkansas has had both Democratic and Republican leadership during periods of both rising and falling crime.
If it were that simple, I’d be selling a “Vote & Reduce Crime 30% Overnight” survival kit.
Final Survivalist Verdict on Arkansas
If you’re moving to Arkansas:
- Want excitement? Research neighborhoods in Little Rock carefully.
- Want stability? Fayetteville is your safest large-city bet.
But remember:
Every city has safe pockets and risky pockets.
Even the safest towns have that one gas station you avoid after 11PM.
Preparation beats paranoia every time.