South Dakota Crime Rankings 2026: Highest Crime City, Safest Large City & U.S. Comparison

When you’re a survival strategist — and yes, a lethal blend of brains and curves — you don’t just feel danger… you quantify it. South Dakota might be known for Mount Rushmore and sweeping plains, but the crime terrain varies wildly across cities. If you’re planning to move, invest, or build a prepper homestead here, data matters more than postcards.

Today we’re dissecting:

🔥 The most dangerous city in South Dakota with 50,000+ residents
🛡️ The safest city in South Dakota with 50,000+ residents
📊 How each ranks nationally in overall U.S. city safety rankings
📍 Where South Dakota ranks among the U.S. states in safety
💡 What all this means for survival, safety, and smart living

Strap in — because I’m about to make crime data as sexy as it is survival-critical.


🕵️‍♀️ Most Dangerous City in South Dakota (Population 50,000+): Sioux Falls

Population: ~190,000+
The largest city in the state — and statistically, the most crime-intense.

📊 Crime Profile

According to the latest FBI-based reporting:

  • Sioux Falls recorded 7,285 total crimes in 2024, the most of any South Dakota city.
  • Its total crime rate sits around 3,442 per 100,000 residents, meaning crime happens at more than three times per person than in some safer states.

While Rapid City often tops crime rates on a per-capita basis, Sioux Falls leads in sheer volume of crime — and that matters if you’re living, working, and driving through it every day.

🔥 Crime Types Driving the Danger

❗ Violent crimes are significantly above state average
❗ Property and theft crimes make up a large share
❗ All categories show trends tied to urban growth and social pressures

This isn’t some tiny statistical blip — Sioux Falls holds the largest share of crime simply because more people live there. That ups both opportunity and risk for crime to occur.


💣 What Makes Sioux Falls So Dangerous?

Here’s the primal truth a prepper will tell you:

1️⃣ Population & Urban Complexity

More people → more targets → more chances for conflict.

2️⃣ Crime Volume, Not Just Rate

Even if the crime rate isn’t the worst in the state, the total count of crimes is the highest — and that equates to real risk.

3️⃣ Economic & Social Pressure Points

Growth can be messy if infrastructure, policing, and support services don’t scale with population.

4️⃣ Youth & Nightlife Dynamics

Busy areas with nightlife, entertainment, and transit hubs are magnet zones for opportunistic crimes.


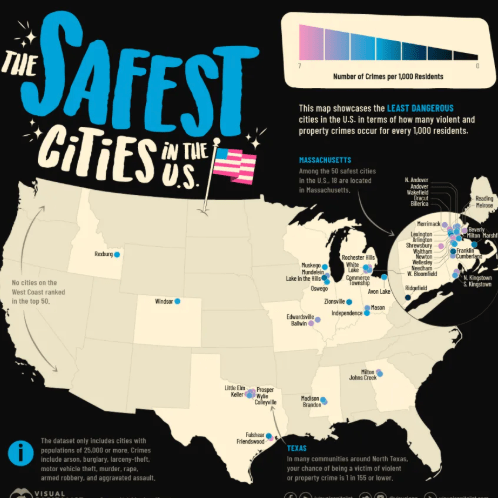
🇺🇸 Sioux Falls National Ranking (50,000+ Cities)

When we consider nationwide data, cities with populations above 50,000 are ranked on overall crime and safety:

👉 Sioux Falls generally lands below average among U.S. cities in safety rankings — especially when using FBI uniform crime data.

It doesn’t penetrate the Top 50 Most Dangerous U.S. Cities, but it does not appear among the safest metro areas either. Nationally, it sits well outside of the safest large-city lists — meaning you should approach everyday life here with eyes wide open and survival instincts engaged.


🛡️ Safest City in South Dakota (Population 50,000+): Sioux Falls — Clarification

Yes — before you ask — South Dakota has a unique reality:

✔ It officially has only one city with 50,000+ populationSioux Falls.
✔ That means it is by definition both the most dangerous and simultaneously the safest city in that population bracket, simply because no other city in the state meets the 50,000 threshold.

So let’s adjust — here’s what that means:


🏙️ Why Sioux Falls Is Relatively Safe Among Large Cities (Even If Crime Is Real)

Look deeper:

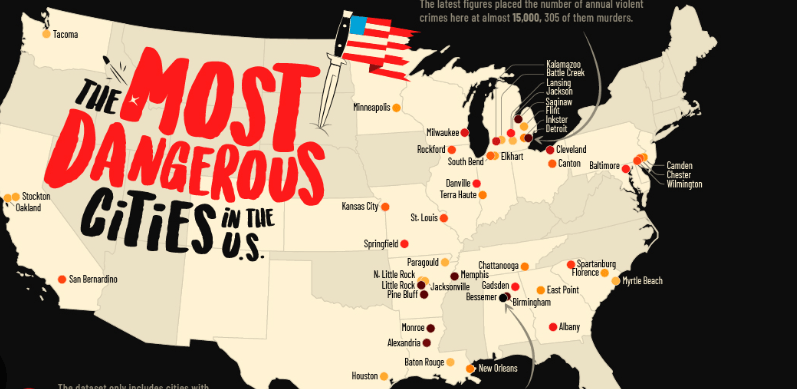
  • Compared to national violent crime averages (~361 per 100K), Sioux Falls’ crime stands near the middle range rather than the extremes seen in U.S. cities like Memphis or Baltimore.
  • South Dakota’s overall violent crime rate is only slightly above the national average — meaning the state isn’t the wild frontier some folks imagine.

So yes — Sioux Falls is “safest” by default among big South Dakota cities… but it’s not a crime-free paradise.


📈 Where South Dakota Ranks Among All 50 States

South Dakota’s statewide crime context:

🔹 Violent crime rate: ~362 per 100,000 — just slightly above the U.S. average.
🔹 Property crime rate: ~1,586 per 100,000 — below national average.

When we combine those figures into an overall crime rate, South Dakota lands roughly in the middle of U.S. state rankings for crime — not near the bottom, and certainly not near the top safest.

👉 That means South Dakota is neither one of the very safest states nor one of the very most dangerous — it sits around the national average for overall crime risk.


💡 Survival Prepper Insights on South Dakota Safety

Listen up — here’s where the real wisdom kicks in:

✅ 1. Context Matters More Than Headlines

South Dakota gets labeled “safe” because national extremes (big cities, high poverty areas) aren’t present here. But normal doesn’t mean risk-free.

✅ 2. Urban Growth = Growing Pains

Sioux Falls is expanding rapidly — and crime dynamics scale with growth.

✅ 3. Always Prep for Personal Safety

Whether you’re in rural ranch country or a booming metro, basic survival prep (situational awareness, community engagement, security systems, personal defense plans) gives you an edge most people miss.

From High Alert to High Comfort: The Most Dangerous and Safest Big Cities in Arkansas (100,000+ Population)

Ladies and gentlemen, grab your flashlight and your sense of humor — we’re heading into the Natural State.

Today, we’re investigating two Arkansas cities with populations over 100,000:

  • The most dangerous and criminally active
  • The safest among the large cities

No fear-mongering. No drama. Just facts, context, and a little wit from your friendly neighborhood survival-prepper-who-reads-crime-data-for-fun.


🟥 The Most Dangerous Large City in Arkansas: Little Rock

Little Rock
Population: ~203,000

When it comes to Arkansas cities with over 100,000 residents, Little Rock consistently reports the highest violent crime rates.

📊 Crime Snapshot (Recent FBI Uniform Crime Reporting Data)

  • Violent crime rate: ~1,500–1,800 per 100,000 residents
  • Homicide rate: Frequently above 20 per 100,000 in peak years
  • Property crime rate: ~4,000+ per 100,000

For context, the national violent crime average typically sits around 380–400 per 100,000. That means Little Rock’s violent crime rate can run roughly 4x the national average.

That’s not “lock yourself in a bunker” territory — but it’s definitely “be aware of your surroundings and don’t leave your truck unlocked with a bass boat attached.”


🔎 What Makes Little Rock More Crime-Prone?

Now let’s think like investigators, not alarmists.

1. Concentrated Poverty Pockets

Like many mid-sized Southern capitals, Little Rock has neighborhoods with high poverty and limited economic mobility — a common correlation with elevated violent crime.

2. Gang Activity

Local law enforcement has repeatedly cited gang-related violence as a contributor to homicide spikes.

3. Drug Trafficking Corridors

Arkansas sits near major interstate transport routes. Narcotics distribution plays a role in crime patterns, especially firearm-related offenses.

4. Urban Density Effect

When you put 200,000 people close together, statistically… things happen. More interactions = more conflict potential.


🇺🇸 Where Does Little Rock Rank Nationally?

Based on recent national crime comparisons for cities over 100,000 residents:

  • Little Rock often ranks between #20 and #35 in the Top 50 Most Dangerous U.S. Cities (violent crime rate basis).

It does not typically land in the Top 10, but it regularly places within the Top 50.

That’s serious — but not Detroit-in-1990 serious.


🟩 The Safest Large City in Arkansas (100,000+): Fayetteville

Fayetteville
Population: ~100,000+

Fayetteville clears the 100,000 threshold and consistently posts the lowest violent crime rate among Arkansas cities of that size.

📊 Crime Snapshot

  • Violent crime rate: ~250–350 per 100,000
  • Property crime rate: ~2,000–2,500 per 100,000
  • Homicide rate: Typically very low, often single digits annually

That violent crime rate is at or below the national average.


🔐 What Makes Fayetteville Safer?

Time to put the detective hat back on.

1. University Effect

Fayetteville is home to University of Arkansas.

College towns often have:

  • Higher education levels
  • More police presence
  • Younger demographic
  • Strong community engagement

2. Economic Stability

Northwest Arkansas has seen major corporate expansion due to proximity to:

  • Walmart (headquartered in Bentonville)
  • Tyson Foods

Higher median income correlates with lower violent crime.

3. Urban Planning & Growth

Fayetteville has invested in infrastructure, walkability, and community programs.

Translation: people feel invested in their city.


🇺🇸 Where Does Fayetteville Rank Nationally?

Among cities over 100,000 residents:

  • Fayetteville does not typically crack the Top 50 Safest Cities nationwide, because many suburban cities post ultra-low rates.
  • However, it generally ranks in the top 30–40% safest mid-sized cities in the U.S.

It’s not “Mayberry,” but it’s solidly stable.


🗺️ Where Does Arkansas Rank Among U.S. States for Safety?

Arkansas

Arkansas generally ranks between:

  • #40 and #45 out of 50 states for overall safety (violent crime rate basis).

Why?

  • Elevated violent crime rates in urban areas
  • Above-average homicide rate statewide
  • Property crime slightly above national average

But here’s the nuance:

Arkansas has large rural areas with extremely low crime. The statewide ranking is pulled upward by concentrated urban violence.

It’s not chaos. It’s uneven distribution.


🏛️ Political Representation Since 1990: Democrats vs Republicans in Arkansas

Now let’s examine leadership history — strictly by numbers.


🟦 Democrats Since 1990

U.S. Senate

Since 1990, Democrats held Arkansas Senate seats until 2015.

Notable:

  • Blanche Lincoln
  • Mark Pryor

Total Democratic U.S. Senators since 1990: 2


U.S. House of Representatives

From 1990 to roughly 2010, Democrats held multiple House seats.

Since 2014, all Arkansas House seats have been Republican.

Estimated total Democratic House members since 1990: At least 6 different individuals.


Democratic Governors Since 1990

  • Bill Clinton (Governor until 1992)
  • Jim Guy Tucker
  • Mike Beebe

Democratic Governors since 1990: 3


🟥 Republicans Since 1990

U.S. Senate

Since 2015, both Senate seats have been Republican:

  • Tom Cotton
  • John Boozman

Republican U.S. Senators since 1990: 2


U.S. House

As of mid-2010s onward:
All 4 House seats are Republican.

Total Republican House members since 1990: Approximately 6+ individuals, mostly in recent years.


Republican Governors Since 1990

  • Mike Huckabee
  • Asa Hutchinson
  • Sarah Huckabee Sanders

Republican Governors since 1990: 3


So… Does Politics Explain Crime?

Here’s the prepper truth:

Crime trends are influenced by:

  • Poverty
  • Education levels
  • Policing strategy
  • Urban density
  • Drug markets
  • Economic opportunity

They are not solely dictated by party control.

Arkansas has had both Democratic and Republican leadership during periods of both rising and falling crime.

If it were that simple, I’d be selling a “Vote & Reduce Crime 30% Overnight” survival kit.


Final Survivalist Verdict on Arkansas

If you’re moving to Arkansas:

  • Want excitement? Research neighborhoods in Little Rock carefully.
  • Want stability? Fayetteville is your safest large-city bet.

But remember:

Every city has safe pockets and risky pockets.

Even the safest towns have that one gas station you avoid after 11PM.

Preparation beats paranoia every time.

California’s Crime Extremes: Most Dangerous City & Safest City in The Golden State

California: A Golden State With a Dark Side and a Bright Side

Welcome to California — home of Hollywood dreamers, tech millionaires, state-mandated almond milk standards, and… some seriously different crime stats depending on where you park your Bug Out Bag.

On one end of the spectrum you have chaotic urban areas where the soundtrack of car alarms and sirens occasionally replaces the coastal breeze. On the other end: sleepy suburbs where the most dangerous thing you’ll find is someone stealing your neighbor’s organic lemon tree starter pack.

Let’s dive into the most dangerous and safest cities in California — then zoom out to see where the state ranks nationally, and wrap our burrito in politics because, hey, it’s California.

(Watch the clip below if you want to know which city in California smells the worst)


🚨 Most Dangerous City in California — According to Crime Stats

Based on the most recent FBI Uniform Crime Reports and crime rate rankings:

  • Among all California cities with populations over 10,000, ]currently tops the list for highest total crime rate per 100,000 residents — significantly ahead of other metros.

Other cities frequently appearing among California’s highest crime rates include Commerce, Oakland, and Santa Fe Springs.

For many residents and visitors, these stats translate to:

  • High property and violent crime.
  • Frequent thefts, assaults, and vehicle break-ins.
  • Struggles with gang activity and socioeconomic disruptions in some areas.

Interestingly, outside of just per capita rates, cities like Stockton have some of the highest murder rates in the state, with around 13.3 homicides per 100,000 residents — and Vallejo exceeding that at 17.2 per 100,000.

Meet Brooke Homestead: 2025 Female Survival Prepper of the Year & Featured Survival Blogger


🛡️ Safest City in California — Crime Discipline on Lock

Flip the crime coin, and the safest city in California for 2026 is Danville, according to recent safety rankings.

Other cities that consistently report exceptionally low crime stats include:

  • Rancho Santa Margarita
  • Lincoln
  • Moorpark
  • Yorba Linda
  • Poway
  • Laguna Niguel
  • San Ramon
  • Thousand Oaks

These areas generally have:
✅ Very low violent crime (often < 1.5 incidents per 1,000 people)
✅ Strong community policing
✅ Higher average incomes and stable employment
✅ Neighborhood watch cultures that could impress even the most vigilant survivalist.


📊 Where These Cities Rank Nationally

Let’s zoom out to the Top 50 national rankings:

  • Safest City (Danville) — While not always in the Top 50 safest in the nation due to population thresholds and differing national metrics, many California suburbs like Danville, Yorba Linda, and Rancho Santa Margarita frequently rank among the top safest communities nationwide in localized FBI-based comparisons.

  • Most Dangerous Cities — Cities like Emeryville and Oakland routinely appear on national lists of high crime urban centers when compared with similar U.S. cities, though they might not always crack the Top 50 most dangerous nationwide lists that use rigid population cutoffs.

🇺🇸 California as a State: Crime Rank In the U.S.

How does California stack up in the national crime report?

According to FBI crime reports:

  • California’s violent crime rate is above the U.S. average — suggesting more violent incidents per capita than most states.
  • California’s property crime rate is also higher than average — reflecting thefts, burglaries, and auto-related crimes.

Depending on the specific dataset, California ranks often in the top 10 worst states for violent crime rates, but the numbers shift year-to-year.

So if the U.S. were a classroom, California might be that kid whose homework is “mostly done” but definitely not the honor roll.


🗳️ California Politics and Crime: A Tangled Web?

Now strap in — because we’re heading into political terrain.

Representation in Congress

As of the latest available data:

  • U.S. House of Representatives Delegation: California has 43 Democrats and 8 Republicans serving in the U.S. Congress, with 1 current vacancy.
    (The exact historical count since 1990 varies as both parties have waxed and waned with redistricting and elections, but Democrats have held a significant delegation majority since the early 2000s.)

U.S. Senate Representation

  • Both U.S. Senate seats from California have been held by Democrats continuously since 1992. Republicans haven’t held a Senate seat since that year.

Governor’s Mansion Since 1990

From 1990 onward:

  • Republican Governors:
    • Pete Wilson (1991–1999)
    • Arnold Schwarzenegger (2003–2011)
  • Democratic Governors:
    • Gray Davis (1999–2003)
    • Gavin Newsom (2019–present)

This means since 1990: 2 Republicans and 2 Democrats have occupied the Governorship.

(Yes, even Schwarzenegger had to give up the keys eventually.)


Survivalist Commentary: Why This Matters

Imagine cruising down the Pacific Coast Highway with a stick shift and a tactical backpack — but the soundtrack alternates between The Beach Boys and a public safety briefing.

That’s California. You might be surrounded by innovation, sunshine, and $8 tacos — and then you check the crime app and decide your smartphone doesn’t have enough battery.

If you’re prepping like a seasoned survivalist:

  • You evaluate your location, not just your zip code.
  • You know where risk converges with opportunity.
  • You laugh — but you also lock your doors.

And that’s exactly why understanding crime stats — and the political environment affecting them — isn’t just trivia. It’s practical readiness.