

California: A Golden State With a Dark Side and a Bright Side
Welcome to California — home of Hollywood dreamers, tech millionaires, state-mandated almond milk standards, and… some seriously different crime stats depending on where you park your Bug Out Bag.
On one end of the spectrum you have chaotic urban areas where the soundtrack of car alarms and sirens occasionally replaces the coastal breeze. On the other end: sleepy suburbs where the most dangerous thing you’ll find is someone stealing your neighbor’s organic lemon tree starter pack.
Let’s dive into the most dangerous and safest cities in California — then zoom out to see where the state ranks nationally, and wrap our burrito in politics because, hey, it’s California.
(Watch the clip below if you want to know which city in California smells the worst)

🚨 Most Dangerous City in California — According to Crime Stats
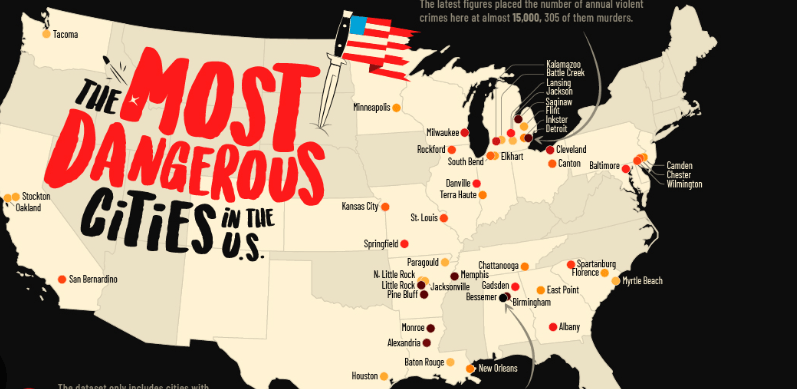
Based on the most recent FBI Uniform Crime Reports and crime rate rankings:
- Among all California cities with populations over 10,000, ]currently tops the list for highest total crime rate per 100,000 residents — significantly ahead of other metros.
Other cities frequently appearing among California’s highest crime rates include Commerce, Oakland, and Santa Fe Springs.
For many residents and visitors, these stats translate to:
- High property and violent crime.
- Frequent thefts, assaults, and vehicle break-ins.
- Struggles with gang activity and socioeconomic disruptions in some areas.
Interestingly, outside of just per capita rates, cities like Stockton have some of the highest murder rates in the state, with around 13.3 homicides per 100,000 residents — and Vallejo exceeding that at 17.2 per 100,000.
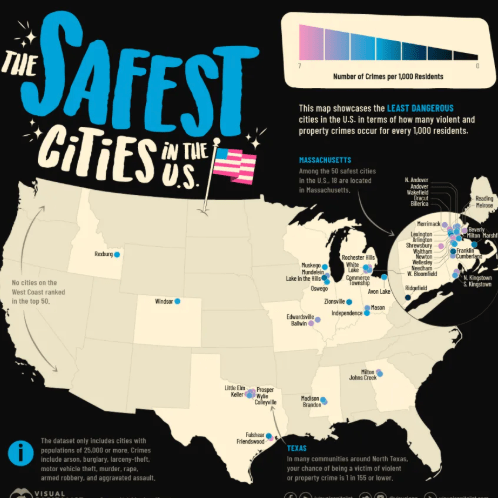
🛡️ Safest City in California — Crime Discipline on Lock

Flip the crime coin, and the safest city in California for 2026 is Danville, according to recent safety rankings.
Other cities that consistently report exceptionally low crime stats include:
- Rancho Santa Margarita
- Lincoln
- Moorpark
- Yorba Linda
- Poway
- Laguna Niguel
- San Ramon
- Thousand Oaks
These areas generally have:
✅ Very low violent crime (often < 1.5 incidents per 1,000 people)
✅ Strong community policing
✅ Higher average incomes and stable employment
✅ Neighborhood watch cultures that could impress even the most vigilant survivalist.
📊 Where These Cities Rank Nationally
Let’s zoom out to the Top 50 national rankings:
- Safest City (Danville) — While not always in the Top 50 safest in the nation due to population thresholds and differing national metrics, many California suburbs like Danville, Yorba Linda, and Rancho Santa Margarita frequently rank among the top safest communities nationwide in localized FBI-based comparisons.
- Most Dangerous Cities — Cities like Emeryville and Oakland routinely appear on national lists of high crime urban centers when compared with similar U.S. cities, though they might not always crack the Top 50 most dangerous nationwide lists that use rigid population cutoffs.
🇺🇸 California as a State: Crime Rank In the U.S.

How does California stack up in the national crime report?
According to FBI crime reports:
- California’s violent crime rate is above the U.S. average — suggesting more violent incidents per capita than most states.
- California’s property crime rate is also higher than average — reflecting thefts, burglaries, and auto-related crimes.
Depending on the specific dataset, California ranks often in the top 10 worst states for violent crime rates, but the numbers shift year-to-year.
So if the U.S. were a classroom, California might be that kid whose homework is “mostly done” but definitely not the honor roll.
🗳️ California Politics and Crime: A Tangled Web?

Now strap in — because we’re heading into political terrain.
Representation in Congress
As of the latest available data:
- U.S. House of Representatives Delegation: California has 43 Democrats and 8 Republicans serving in the U.S. Congress, with 1 current vacancy.
(The exact historical count since 1990 varies as both parties have waxed and waned with redistricting and elections, but Democrats have held a significant delegation majority since the early 2000s.)
U.S. Senate Representation
- Both U.S. Senate seats from California have been held by Democrats continuously since 1992. Republicans haven’t held a Senate seat since that year.
Governor’s Mansion Since 1990
From 1990 onward:
- Republican Governors:
- Pete Wilson (1991–1999)
- Arnold Schwarzenegger (2003–2011)
- Democratic Governors:
- Gray Davis (1999–2003)
- Gavin Newsom (2019–present)
This means since 1990: 2 Republicans and 2 Democrats have occupied the Governorship.
(Yes, even Schwarzenegger had to give up the keys eventually.)
Survivalist Commentary: Why This Matters
Imagine cruising down the Pacific Coast Highway with a stick shift and a tactical backpack — but the soundtrack alternates between The Beach Boys and a public safety briefing.
That’s California. You might be surrounded by innovation, sunshine, and $8 tacos — and then you check the crime app and decide your smartphone doesn’t have enough battery.
If you’re prepping like a seasoned survivalist:
- You evaluate your location, not just your zip code.
- You know where risk converges with opportunity.
- You laugh — but you also lock your doors.
And that’s exactly why understanding crime stats — and the political environment affecting them — isn’t just trivia. It’s practical readiness.
