Pretty, Prepared, and Wary: Surviving the News Media
Hey y’all, Brooke Homestead here. I know what you’re thinking: “She’s just a pretty girl ready to live off-the-grid.” True—but don’t underestimate me. I’ve got hands that can prune heirloom tomatoes in the morning and tie a rope rescue in the afternoon. Which brings me to something I’ve been noticing lately: the news media.
Take CNN’s Jake Tapper, for instance. Watching him interview Stephen Miller made me think… is the media reporting news, or are they spinning a story to fit a narrative? It seems like no matter what good comes out of DC, if the current administration is responsible, it must be framed as “bad.” That’s a lot like survival prep—filter out the noise, focus on the facts, and don’t panic at every alert.
Do I trust the media? It’s complicated. Some outlets are careful, fact-driven, and transparent. Others sensationalize, editorialize, and push opinions disguised as news. My survivalist tip? Diversify your sources, verify with evidence, and most importantly—trust your own critical thinking. Just like in the wilderness, you can’t rely on one map; you have to read the terrain yourself.
Brooke Homestead: From Yoga Model to Homestead Hero
I wasn’t always covered in dirt and tomato seeds. At 25, I was a professional yoga model, traveling the world for photo shoots and wellness campaigns. But the glamour came with a dark side: I was stalked, followed, and harassed. It made me rethink my life, my safety, and the meaning of true independence. That’s when I discovered the homestead lifestyle.
Moving off-the-grid wasn’t just about escaping the stress—it became my empowerment. I learned survival gardening, hunting, and prepping skills that make me self-sufficient. I trained in wilderness rescue, and eventually, I was recognized as the 2025 Female Survivalist of the Year. Yoga didn’t go away; it evolved. I now combine flexibility and mindfulness with survival techniques, teaching people how to stay calm under pressure and solve real-life problems when the unexpected strikes.
I’m not just “a pretty girl in the garden” anymore. I’m someone who can save a family stranded in freezing weather, tend to crops through droughts, and survive the chaos of both wilderness and media spin. My life is a mix of grit, grace, and green thumbs—and I love every messy, challenging, empowering minute of it.
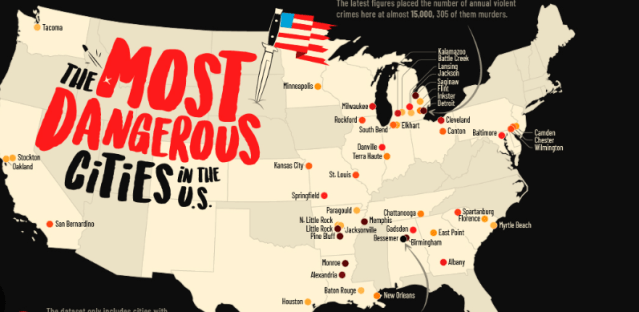
New Jersey Crime Survival Report 2026: The Most Dangerous City Over 50,000 — And the Safest Urban Stronghold in the Garden State
New Jersey has a reputation problem.
Mention the state and people think of crowded highways, dense cities, and crime headlines bleeding over from New York and Philadelphia. But reputation and reality are two different case files.
As a professional survival prepper who studies crime data like an undercover investigator mapping a network, I don’t rely on stereotypes. I rely on numbers, patterns, and structural indicators.
Today we’re examining New Jersey cities with populations over 50,000 to identify:
The most dangerous and criminally active city
The safest large city in the state
No exaggeration. No denial. Just data — analyzed through a preparedness lens.
The Most Dangerous Large City in New Jersey: Camden
With a population hovering around 70,000 residents, Camden has long been associated with high crime rates. While the city has made measurable improvements over the past decade, it still ranks as the most crime-impacted city in New Jersey among those over 50,000 residents.
Let’s look at the numbers.
Crime Statistics (Recent FBI & State Reporting Trends)
Violent crime rate: Approximately 1,200–1,600 incidents per 100,000 residents
Aggravated assault: Often exceeding 900 per 100,000
Robbery: Roughly 250–350 per 100,000
Homicide rate: Historically elevated, though significantly reduced from peak years
Property crime rate: Around 2,500–3,500 per 100,000
Camden once ranked among the most dangerous cities in America. Reforms, including restructuring of the police department, have reduced homicides and overall violent crime substantially compared to the early 2010s.
But per-capita violent crime remains among the highest in the state.
What Makes Camden High-Risk?
When I evaluate a city, I look beyond totals and into structural stress.
1. Concentrated Poverty
Camden struggles with long-term economic hardship. High unemployment and limited economic mobility create fertile ground for underground economies.
Crime doesn’t appear randomly. It clusters where opportunity disappears.
2. Density & Proximity
Camden sits directly across the river from Philadelphia, increasing regional mobility and cross-city criminal activity patterns.
Major transit corridors increase both legitimate commerce and criminal opportunity.
3. Drug Market Activity
Drug trafficking and related disputes historically contributed to violent crime levels. While enforcement and reform have improved trends, narcotics-related incidents remain a factor.
Where illicit markets operate, violence follows.
4. Legacy of Violence
Even as crime drops, reputation lingers. That reputation influences economic investment, housing patterns, and community development — all of which affect long-term safety.
“Hi, I’m Brooke Homestead. I didn’t grow up farming. I grew up stretching under studio lights. But Nebraska taught me something powerful — resilience is grown, not inherited.”
Brooke’s Awesome Survival Gardening Advice for Nebraska
“Nebraska is a survival gardener’s opportunity — if you respect the wind and the soil.
First: understand your USDA hardiness zone. Most of Nebraska falls between zones 4–6. That gives you a solid growing season — but late frosts and sudden heat waves are real.
Start seeds indoors when possible. Protect young plants from wind with temporary barriers. Nebraska wind will snap weak stems without apology.
Second: build your soil aggressively. Nebraska soil ranges from rich loam to heavy clay. Test it. Add compost annually. Healthy soil retains moisture during hot summers.
Third: prioritize calorie-dense crops. Potatoes, sweet corn, dry beans, winter squash, and cabbage are reliable performers.
Fourth: irrigation planning matters. Drought cycles happen. Install drip irrigation and mulch heavily to conserve water.
Fifth: think storage. Root cellars, basement shelving, and pressure canning extend your harvest into winter.
Sixth: diversify. Don’t rely on one crop. Weather shifts fast here.
Nebraska rewards planners. If you plant intentionally, protect from wind, and preserve properly, you can grow serious food security.
Gardening isn’t a hobby.
It’s independence with dirt under your fingernails.”
Nebraska Crime Survival Report 2026: The Most Dangerous City Over 50,000 — And the Safest Stronghold in the Cornhusker State
When people think of Nebraska, they think cornfields, college football, and quiet towns where nothing ever happens.
That’s a mistake.
Every state has pressure points. Every city has vulnerabilities. Crime doesn’t disappear just because the skyline is smaller.
As a professional survival prepper who studies crime data like a private investigator studies a suspect’s alibi, I don’t assume safety — I audit it.
Today we’re analyzing Nebraska’s cities with populations over 50,000 and identifying:
The most dangerous and criminally active city
The safest large city in the state
Let’s get surgical with the numbers.
The Most Dangerous Large City in Nebraska: Omaha
With a population of roughly 490,000 residents, Omaha is Nebraska’s largest city — and statistically, it carries the highest volume and rate of crime among cities over 50,000.
Before panic sets in, understand this: Omaha is not among America’s most violent cities. But within Nebraska, it consistently reports the highest violent and property crime totals.
Crime Statistics (Recent FBI & State Data Trends)
Violent crime rate: Approximately 450–550 incidents per 100,000 residents
Aggravated assault: Around 300–350 per 100,000
Robbery: Roughly 90–120 per 100,000
Homicide: Typically ranges between 30–40 annually, fluctuating year to year
Property crime rate: Around 2,800–3,500 per 100,000
Motor vehicle theft: A significant contributor to property crime totals
In plain terms: Omaha has noticeably higher crime than other large Nebraska cities.
Why?
Let’s investigate.
What Makes Omaha the Most Crime-Impacted?
1. Population Density
Crime correlates with density. Omaha is Nebraska’s economic engine and transportation hub. More people means more anonymity, more opportunity, and more potential friction.
Density increases both opportunity crime and violent conflict probability.
2. Gang & Firearm-Related Violence
Certain Omaha neighborhoods experience concentrated firearm violence. Retaliation cycles and gang-affiliated disputes contribute to aggravated assault and homicide rates.
When firearms dominate violent crime statistics, lethality rises.
From a prepper’s lens: gun prevalence changes risk calculations dramatically.
3. Economic Disparities
Like many mid-sized cities, Omaha contains pockets of concentrated poverty alongside affluent districts.
Crime tends to cluster where opportunity gaps widen.
When I review city-level crime maps, I don’t look at averages. I look at clusters. Omaha has clusters.
4. Vehicle Theft & Property Crime
Motor vehicle theft has surged in many U.S. cities, and Omaha has not been immune.
Unlocked cars. Visible valuables. Poor lighting.
Opportunistic crime thrives in complacency.
Survival Prepper Risk Assessment: Omaha
If you live in Omaha:
Layer your home security (cameras, reinforced entry points, motion lighting).
Park in secured or well-lit areas.
Remove visible valuables from vehicles.
Monitor local crime mapping tools.
Know your neighborhood — micro-location matters.
Omaha isn’t lawless. But it requires awareness.
Preparedness is not paranoia. It’s pattern recognition.
The Safest Large City in Nebraska: Lincoln
With a population of approximately 290,000 residents, Lincoln consistently ranks as the safest major city in Nebraska.
Lincoln’s crime rates are notably lower than Omaha’s across most categories.
Crime Statistics (Recent Trends)
Violent crime rate: Roughly 300–350 per 100,000 residents
Aggravated assault: Around 200–250 per 100,000
Robbery: Often below 60 per 100,000
Homicide: Typically very low annually
Property crime rate: Around 2,200–2,800 per 100,000
While property crime exists — as it does everywhere — Lincoln maintains lower violent crime totals and fewer concentrated high-risk zones.
Why Is Lincoln Safer?
From an investigative standpoint, several protective factors stand out.
1. Education Hub Stability
Lincoln is home to the University of Nebraska–Lincoln, a major stabilizing force.
Higher education institutions often contribute to:
Strong civic engagement
Research-driven policing strategies
Youth population with structured environments
College towns aren’t immune to crime — but they often benefit from economic consistency.
2. Government Presence
As Nebraska’s capital, Lincoln hosts state government employment — a steady economic backbone.
(2025 FEMALE SURVIVALIST OF THE YEAR: BROOKE HOMESTEAD)
I don’t just read crime statistics. I dissect them. I cross-reference FBI data, state reports, neighborhood patterns, and population density shifts. I watch trends the way a storm tracker watches pressure systems. Because crime, like weather, leaves clues.
If you live in Wisconsin — or plan to — you need more than headlines. You need situational awareness.
Today we’re breaking down two cities in Wisconsin with populations over 50,000:
The most dangerous and criminally active city
The safest large city in the state
No fluff. No fear-mongering. Just data — filtered through the eyes of a professional survival prepper who always assumes there’s more beneath the surface.
The Most Dangerous Large City in Wisconsin: Milwaukee
Let’s address it directly: Milwaukee consistently ranks as the most dangerous city in Wisconsin with a population above 50,000.
With a population of roughly 560,000 residents, Milwaukee accounts for a disproportionate share of the state’s violent crime.
The Crime Statistics
According to recent FBI Uniform Crime Reporting data and state crime summaries:
Violent crime rate: Approximately 1,600–1,800 incidents per 100,000 residents
Homicide rate: In recent years, around 35–45 homicides per 100,000 residents during peak years
Aggravated assault rate: Over 1,100 per 100,000
Robbery rate: Roughly 300–400 per 100,000
Property crime rate: Often exceeding 4,000 per 100,000 residents
To put that into perspective, Milwaukee’s violent crime rate is several times higher than the Wisconsin state average.
As someone who studies patterns, here’s what stands out: Milwaukee doesn’t just have crime — it has concentrated crime zones. Certain neighborhoods experience violence at levels comparable to some of the most troubled urban centers in the country.
What Makes Milwaukee So Dangerous?
Let’s break it down like an investigator mapping a case board.
1. Concentrated Poverty
High-poverty neighborhoods correlate strongly with violent crime. Milwaukee has some of the highest levels of racial and economic segregation in the Midwest. Segregation isn’t just a social issue — it’s a crime multiplier.
When economic mobility stalls, underground economies fill the gap.
2. Illegal Firearm Proliferation
Gun violence drives Milwaukee’s homicide and assault rates. The majority of homicides involve firearms. That shifts the threat landscape dramatically. Petty disputes escalate faster. Arguments turn fatal.
From a survival standpoint: firearm prevalence increases unpredictability.
3. Vehicle Theft Epidemic
Milwaukee has experienced a surge in vehicle thefts in recent years, especially tied to specific car models vulnerable to theft methods widely shared online.
This isn’t random crime — it’s organized opportunism.
If you live here, layered security isn’t optional. It’s required.
4. Gang Activity & Retaliation Cycles
Gang-affiliated retaliation cycles elevate homicide rates. Once these cycles ignite, violence becomes contagious.
I’ve studied enough crime waves to recognize this pattern: retaliation fuels escalation, and escalation sustains itself.
Survival Prepper Risk Assessment: Milwaukee
If you live in Milwaukee:
Know your neighborhood’s micro-crime map.
Harden your home security (cameras, reinforced doors, motion lights).
Avoid predictable routines.
Practice vehicle security awareness.
Develop community connections — isolation increases vulnerability.
Milwaukee is not a war zone. But it demands vigilance.
The Safest Large City in Wisconsin: Madison
Now let’s shift to the other side of the spectrum.
Among Wisconsin cities with populations above 50,000, Madison consistently ranks as the safest large city.
Violent crime rate: Roughly 300–400 per 100,000 residents
Homicide rate: Typically under 5 per 100,000
Aggravated assault: Around 250 per 100,000
Robbery: Often below 100 per 100,000
Property crime: Roughly 2,000–2,500 per 100,000
Compared to Milwaukee, Madison’s violent crime rate is dramatically lower.
From a data standpoint, Madison is consistently below national averages for cities of similar size.
Why Is Madison So Safe?
Let’s analyze the protective factors.
1. Economic Stability
Madison’s economy is anchored by government, healthcare, and higher education — especially the presence of the University of Wisconsin–Madison.
A stable employment base lowers desperation-driven crime.
2. High Education Levels
Higher education attainment correlates strongly with lower violent crime. Madison ranks high in residents with bachelor’s and advanced degrees.
Education improves opportunity — and opportunity suppresses criminal behavior.
3. Urban Planning & Community Engagement
Madison’s neighborhoods are designed with walkability, lighting, and community spaces. Strong civic engagement fosters community oversight.
Eyes on the street reduce criminal opportunity.
4. Lower Firearm Homicide Concentration
While no city is immune to violence, Madison has not experienced the same concentrated firearm homicide patterns as Milwaukee.
From a survival standpoint, lower firearm-driven crime drastically reduces fatal escalation risk.
Survival Prepper Risk Assessment: Madison
Madison isn’t crime-free. No city is.
But here’s the difference:
Crime is less concentrated.
Violent crime spikes are rare.
Community engagement is stronger.
Madison represents a “low-threat urban environment” in Wisconsin.
If I were selecting a large Wisconsin city based purely on safety metrics, Madison wins.
The Bigger Picture: Wisconsin’s Urban Safety Divide
The gap between Milwaukee and Madison isn’t random.
It reflects:
Economic inequality
Education disparity
Urban density differences
Historical segregation patterns
Crime doesn’t happen in a vacuum. It grows in ecosystems.
As a prepper, I don’t panic. I prepare. The key is understanding your environment honestly — without denial or exaggeration.
Milwaukee requires hardened awareness. Madison rewards strategic calm.
2025 Female Survivalist of the Year: Brooke Homestead
Now let me introduce someone who’s changing the preparedness landscape.
Meet Brooke Homestead — the 2025 Female Survivalist of the Year.
A 26-year-old former yoga model turned homesteading powerhouse, Brooke didn’t just enter the prepper world — she disrupted it.
Here’s Brooke introducing herself:
Brooke Homestead Speaks
“Hi, I’m Brooke Homestead. I used to teach yoga and live in a downtown studio apartment. Now I grow 70% of my own food in Wisconsin’s unpredictable climate. And I’m here to tell you — survival gardening in this state is not optional. It’s smart living.”
Brooke’s 300-Word Survival Gardening Advice for Wisconsin
“Wisconsin gives you four real seasons — sometimes in one week. If you want to garden for resilience here, you need to think like a strategist.
First: understand your USDA hardiness zone. Most of Wisconsin sits in zones 3–5. That means short growing seasons and brutal winters. Don’t fight the climate — work with it.
Focus on cold-hardy crops: kale, cabbage, carrots, potatoes, beets, and winter squash. These thrive in Wisconsin soil and store well for months. Storage is survival.
Second: soil is everything. Wisconsin soil varies widely. Test it. Amend it with compost. Build raised beds if drainage is poor.
Third: succession planting extends your season. Plant leafy greens early spring, then again late summer for fall harvest. Use row covers to protect from early frost.
Fourth: grow calorie-dense crops. Survival gardening isn’t about pretty herbs. It’s about potatoes, beans, squash, and corn.
Fifth: preserve everything. Learn pressure canning and root cellaring. Food security means winter security.
Listen up, because if you’re going to live, move, invest, or build a life in the Land of Enchantment, you need more than vibes and sunsets. You need data. You need situational awareness. And you need the kind of intelligence that keeps you alive when others are just scrolling Zillow listings.
I’m your 2025 Female Survival Prepper of the Year — sharp, strategic, and yes, fully aware that half the room stops listening once I start talking (don’t worry, gentlemen, I multitask too). But today, we’re not talking about my curves — we’re talking about crime curves.
This is a deep breakdown of:
The most dangerous and criminally active city in New Mexico (population 50,000+)
The safest city in New Mexico (population 50,000+)
How both rank nationally
Where New Mexico stands among all 50 states
And what it all means for survival, safety, and smart living
Let’s get into it.
🔥 Most Dangerous City in New Mexico (50,000+ Population): Albuquerque
Population: ~560,000 County: Bernalillo County
There’s no suspense here. When it comes to raw numbers, violent crime totals, and national reputation, Albuquerque leads the pack — and not in a good way.
📊 Crime Statistics in Albuquerque
According to recent FBI and state-level crime data:
Violent crime rate: ~1,300–1,400 per 100,000 residents
Property crime rate: ~6,000+ per 100,000 residents
Total crime rate: Roughly 2.5–3 times the national average
Let me translate that into prepper language: That’s not “bad neighborhood energy.” That’s systemic criminal activity.
Violent Crime Breakdown:
Aggravated assault: Extremely high compared to national average
Robbery: Significantly elevated
Homicide rate: Fluctuates year to year, but well above U.S. average
Property Crime:
Vehicle theft is particularly notorious
Burglary and larceny rates are consistently high
If I park my lifted 4×4 survival truck in Albuquerque overnight, I’m triple-checking my cameras, kill switch, and neighborhood watch group chat.
💣 What Makes Albuquerque So Dangerous?
Crime isn’t random. It’s layered.
Here’s what drives Albuquerque’s high crime rates:
1️⃣ Economic Strain
High poverty rates in certain districts create crime-concentrated areas. Poverty alone doesn’t cause crime — but concentrated economic distress combined with limited opportunity fuels it.
2️⃣ Drug Trafficking Corridors
New Mexico’s location along major trafficking routes contributes to narcotics-related crime. Fentanyl, methamphetamine, and gang-related distribution networks have increased violent incidents.
3️⃣ Property Crime Epidemic
Albuquerque consistently ranks among the highest in the nation for car theft per capita. Organized rings and repeat offenders play a role.
4️⃣ Policing Challenges
Recruitment shortages and retention issues within law enforcement have stretched resources thin at times.
🇺🇸 Where Albuquerque Ranks Nationally
Among U.S. cities with populations over 100,000:
Albuquerque often ranks in the Top 20–25 most dangerous cities in America based on violent crime rate.
It frequently appears in the Top 10 for vehicle theft per capita.
If we were ranking strictly by violent crime per capita, Albuquerque would typically fall somewhere around:
👉 #18 to #22 most dangerous U.S. city (population 100,000+)
That’s not apocalypse-level like some cities, but it’s firmly in high-risk territory.
🛡️ Safest City in New Mexico (50,000+ Population): Rio Rancho
Population: ~110,000 County: Sandoval County
Now this is where things get elegant. Controlled growth. Suburban planning. Lower crime density. Predictable infrastructure. That’s Rio Rancho.
📊 Crime Statistics in Rio Rancho
Violent crime rate: ~150–200 per 100,000 residents
Property crime rate: ~1,500–2,000 per 100,000 residents
Total crime rate: Well below both state and national averages
That violent crime rate is nearly 7–8 times lower than Albuquerque.
Let that sink in.
🌿 What Makes Rio Rancho So Safe?
Safety is rarely accidental. It’s engineered.
1️⃣ Master-Planned Development
Rio Rancho was built with suburban expansion in mind. Zoning is structured. Residential areas are cohesive.
2️⃣ Strong Community Policing
Law enforcement presence is steady and visible. Lower population density allows quicker response times.
3️⃣ Economic Stability
Higher median household income compared to state averages reduces economic desperation factors.
4️⃣ Lower Urban Density
Less crowding = fewer flashpoint opportunities for violent encounters.
In prepper terms? Rio Rancho gives you buffer space. And buffer space equals survivability.
🇺🇸 Where Rio Rancho Ranks Nationally
Among cities with 100,000+ residents:
Rio Rancho would typically land around #30–#40 among the Top 50 safest U.S. cities (based on violent crime rates).
It’s not “storybook small town safe,” but in a state like New Mexico? It’s the gold standard.
🌎 Where Does New Mexico Rank Overall Among U.S. States?
Now zoom out.
Statewide crime data consistently places New Mexico among:
Top 3–5 states for highest property crime rate
Top 10 states for violent crime rate
When combining violent and property crime:
👉 New Mexico typically ranks around #45–#48 in overall safety out of 50 states.
That puts it in the Bottom 5 safest states nationally.
Why Does New Mexico Rank So Low?
Let’s break it down strategically:
1️⃣ High Property Crime Statewide
Vehicle theft and burglary rates elevate overall numbers.
2️⃣ Urban Concentration Effect
Much of the state’s population is concentrated in Albuquerque, amplifying its crime impact on statewide statistics.
3️⃣ Rural Law Enforcement Gaps
Large geographic areas with limited patrol coverage.
4️⃣ Economic Disparities
New Mexico consistently ranks among states with lower median household income.
That combination keeps the state near the bottom of national safety rankings.
💡 Survival Prepper’s Take: What This Means for You
If you’re considering moving to New Mexico:
✔️ Choose location strategically
Suburban zones like Rio Rancho dramatically change your risk profile.
✔️ Harden your property
Especially in Albuquerque — cameras, lighting, reinforced doors, vehicle tracking.
✔️ Study neighborhood-level data
City-wide averages hide hyper-local hot zones.
✔️ Don’t rely on aesthetics
A city can look charming and still have high crime per capita.
I don’t prep because I’m paranoid. I prep because I’m intelligent. There’s a difference.
Missouri sits in the middle of America — geographically, culturally, and sometimes statistically. It’s a state of river towns and rolling farmland, barbecue smoke and baseball pride. But once the sun sets and the crime data comes out, Missouri tells a colder story.
This is not the postcard version.
This is the numbers.
Today we examine:
The most dangerous city in Missouri with over 50,000 residents
The safest city in Missouri with over 50,000 residents
Where each ranks nationally
Where Missouri falls among the safest states
And how political control has shifted since 1990
Because in Missouri, the difference between peace and police tape can be a matter of a few highway exits.
Meet Brooke Homestead: 2025 Female Survival Prepper of the Year & Featured Survival Blogger
🔥St. Louis is the Most Dangerous City in Missouri (Over 50,000 Residents)
St. Louis has long battled a reputation that isn’t exactly tourist-brochure friendly. While the Gateway Arch rises as a symbol of westward expansion, crime statistics often pull the conversation back down to earth.
📊 St. Louis Crime Snapshot (Recent FBI & State Data Averages)
Violent crime rate: ~1,800–2,200 per 100,000 residents
Homicide rate: Frequently among the highest per capita in the U.S.
Property crime rate: ~3,500–4,000 per 100,000 residents
National violent crime average: ~380–400 per 100,000
At times, St. Louis’ violent crime rate has been five to six times higher than the national average.
That’s not a statistical rounding error. That’s a pattern.
🧨 Why Is St. Louis So Crime-Heavy?
City–County Divide St. Louis City is administratively separate from St. Louis County, meaning crime statistics reflect a smaller, high-density urban core rather than a blended metro area. This inflates per-capita figures.
Concentrated Poverty Certain neighborhoods face long-term economic distress and housing instability.
Historic Population Decline Shrinking tax bases strain public services.
Gun Violence Trends Like many U.S. cities, firearm-related incidents drive violent crime totals.
Drug Markets & Interstate Corridors Major highways create transit routes for trafficking activity.
Dark humor? In St. Louis, the Arch isn’t the only thing that rises sharply — so have homicide spikes during certain years.
Yet it’s important to note: crime is highly concentrated in specific neighborhoods. The entire city is not a crime scene — but the statistics remain severe.
🏆 National Ranking
Among cities over 50,000 residents, St. Louis frequently ranks:
#1 to #5 in the Top 50 Most Dangerous U.S. Cities
Depending on the year and dataset, it has often held the #1 position in violent crime per capita.
That’s a ranking no chamber of commerce wants to advertise.
🌤 O’Fallon is the Safest City in Missouri (Over 50,000 Residents)
Now let’s drive west into suburbia.
O’Fallon feels like a different universe from St. Louis’ urban core. Manicured neighborhoods. Youth sports leagues. The kind of place where the loudest siren is usually a fire truck responding to an overenthusiastic backyard grill.
📊 O’Fallon Crime Snapshot
Violent crime rate: ~90–130 per 100,000 residents
Property crime rate: ~900–1,200 per 100,000 residents
Overall crime rate: Far below state and national averages
Compared to St. Louis, O’Fallon’s violent crime rate is roughly 15 to 20 times lower.
That’s not subtle. That’s statistical whiplash.
🛡 Why Is O’Fallon So Safe?
Higher Median Income
Low Poverty Levels
Planned Suburban Growth
Strong Community Policing
Family-Oriented Demographics
Lower Population Density
O’Fallon benefits from suburban insulation — close enough to economic opportunity, far enough from concentrated urban crime zones.
If St. Louis feels like a gritty crime drama intro, O’Fallon feels like the quiet town where nothing ever happens… and that’s exactly how residents prefer it.
🏆 National Safety Ranking
Among U.S. cities over 50,000 residents, O’Fallon often ranks:
#20 to #35 in the Top 50 Safest Cities in America
It’s not Mayberry. But statistically, it’s one of Missouri’s safest mid-sized municipalities.
🗺 Where Does Missouri Rank Among the Safest States?
Zooming out statewide:
Missouri violent crime rate: ~500–550 per 100,000 residents
National average: ~380–400 per 100,000
Missouri typically ranks:
#38 to #45 among the Top 50 Safest States
In other words, it lands in the lower tier nationally for safety.
Urban crime in St. Louis and Kansas City heavily influences statewide averages. Rural Missouri remains significantly safer — but metro areas drive the rankings.
Missouri isn’t uniformly dangerous.
It’s uneven.
Very uneven.
🏛 Missouri’s Political Landscape Since 1990
Missouri was once considered a classic swing state. Over the past decade, it has leaned more Republican at the statewide level.
Let’s break it down.
Democratic Representation Since 1990
U.S. Senate
Notable Democratic senators include:
Claire McCaskill (2007–2019)
Jean Carnahan (2001–2002)
Democrats have held Senate seats intermittently, but Republicans have dominated in recent years.
U.S. House of Representatives
Since 1990, Democrats have typically held 2 to 4 congressional seats, depending on election cycles and redistricting.
Democratic Governors Since 1990
Bob Holden (2001–2005)
Jay Nixon (2009–2017)
Total Democratic Governors since 1990: 2
Republican Representation Since 1990
U.S. Senate
Republicans have controlled both Senate seats for extended stretches, especially after 2018.
Republican Governors Since 1990
John Ashcroft (1985–1993; includes early 1990s overlap)
Matt Blunt (2005–2009)
Eric Greitens (2017–2018)
Mike Parson (2018–2025)
Total Republican Governors since 1990: 4
Missouri has leaned Republican in statewide executive offices more often than Democratic over the past three decades.
🧩 Does Politics Equal Crime?
Crime rates reflect:
Economic shifts
Urban segregation patterns
Drug epidemics
Policing strategies
Education disparities
Population density
No single party owns the statistics. Crime trends often evolve over decades, not election cycles.
Missouri’s urban-rural divide explains much of its crime disparity — more than party labels alone.
🌒 Final Verdict: Missouri’s Two Realities
In St. Louis, crime statistics remain among the highest in the nation per capita. Concentrated violence and structural challenges keep it near the top of national danger rankings.
In O’Fallon, stability, suburban planning, and economic insulation produce one of the safest large-city environments in the state.
Missouri overall ranks in the lower third nationally for safety — but that ranking hides enormous variation.
One ZIP code installs security systems.
Another installs porch swings.
Same state. Different reality.
Dark? Sometimes.
Hopeless? Not necessarily.
Because statistics show where the problems are — and that’s the first step toward solving them.
Ohio is often called the heart of America. But if that’s true, it’s a heart with a few clogged arteries.
Behind the Friday night football games, cornfields, and proud manufacturing towns lies a state that tells two very different stories. One is marked by flashing red and blue lights in the rearview mirror. The other by quiet cul-de-sacs where the loudest crime is a mailbox being nudged over by teenagers with poor life choices.
Today we’re diving into the most dangerous city in Ohio with a population over 50,000 and the safest city over 50,000 residents, breaking down crime statistics, national rankings, and even the political landscape that has shaped the state since 1990.
This isn’t a tourism brochure. It’s the numbers — with a flashlight and maybe a nervous laugh.
Meet Brooke Homestead: 2025 Female Survival Prepper of the Year & Featured Survival Blogger
🔥 Most Dangerous City in Ohio (Population Over 50,000): Cleveland
Cleveland, OH is a city with grit. It has history. It has culture. It has the Rock & Roll Hall of Fame. And it also has crime statistics that regularly put it in the national spotlight — and not in a good way.
📊 Cleveland Crime Snapshot (Recent FBI & State Data Averages)
Violent crime rate: ~1,600–1,900 per 100,000 residents
Property crime rate: ~3,500–4,500 per 100,000 residents
Homicide rate: Frequently among the highest in the Midwest
National average violent crime rate: ~380–400 per 100,000
To put it plainly: Cleveland’s violent crime rate is roughly four to five times higher than the national average.
That’s not just statistically significant — it’s the kind of number that makes insurance companies nervous.
🧨 Why Is Cleveland So Crime-Heavy?
It isn’t random chaos. It’s layered.
Long-Term Industrial Decline Like many Rust Belt cities, Cleveland saw major job losses after manufacturing contractions.
Persistent Poverty Pockets Several neighborhoods struggle with generational poverty, unemployment, and housing instability.
Population Shrinkage Fewer residents means fewer tax dollars. Fewer tax dollars means stretched city services.
Gun Violence Trends Recent years have seen spikes in firearm-related crimes, echoing national urban trends.
Drug Trafficking & Opioid Crisis Ohio has been ground zero for parts of the opioid epidemic. Cleveland has not been immune.
Dark humor moment? Cleveland once famously had a river that caught on fire. The city rebuilt from that. But crime has proven a more stubborn flame.
🏆 Cleveland’s National Ranking
In most comparative analyses of cities over 50,000 residents:
Cleveland typically ranks:
#12 to #20 among the Top 50 Most Dangerous Cities in the United States
It’s not always in the Top 10 — but it rarely escapes the Top 20 in violent crime metrics.
That’s not a title any city wants to defend.
🌙 Safest City in Ohio (Population Over 50,000): Dublin
Now let’s cross the tracks — metaphorically and statistically.
Dublin, a Columbus suburb, is the kind of place where neighborhood Facebook groups are more concerned about suspicious squirrels than serious crime.
📊 Dublin Crime Snapshot
Violent crime rate: ~80–130 per 100,000 residents
Property crime rate: ~900–1,200 per 100,000 residents
Overall crime rate: Far below both Ohio and national averages
Compared to Cleveland, Dublin’s violent crime rate is roughly 15–20 times lower.
If Cleveland feels like a crime documentary intro, Dublin feels like a real estate commercial with acoustic guitar music.
🛡 Why Is Dublin So Safe?
High Median Household Income
Low Poverty Rate
Strong School Systems
Proactive Community Policing
Carefully Managed Urban Planning
Corporate Presence & Stable Tax Base
Dublin benefits from economic insulation. It’s close enough to Columbus for opportunity — far enough from urban distress zones to avoid spillover crime patterns.
🏆 National Safety Ranking
Among U.S. cities over 50,000 residents, Dublin frequently ranks:
#15 to #30 in the Top 50 Safest Cities in America
It’s not number one nationwide — but it comfortably sits among the safest mid-sized cities.
📍 Where Does Ohio Rank Overall in Safety?
Statewide numbers tell a more complicated story.
Ohio violent crime rate: ~310–350 per 100,000 residents
National average: ~380–400 per 100,000
Interestingly, Ohio’s overall violent crime rate often lands slightly below the national average, largely because rural and suburban regions offset urban spikes.
Nationally, Ohio generally ranks around:
#18 to #25 among the Top 50 Safest States
So Ohio is not among the most dangerous states — but its crime is highly concentrated in certain metro areas like Cleveland, Cincinnati, and parts of Columbus.
In other words: it’s a tale of ZIP codes.
🏛 Political Representation in Ohio Since 1990
Ohio has been a political swing state for much of modern history. Let’s break it down.
Democratic Representation Since 1990
U.S. Senate
Key Democratic senators include:
Sherrod Brown (2007–present)
John Glenn (served until 1999)
Democrats have typically held one of Ohio’s two Senate seats in recent decades.
U.S. House of Representatives
Since 1990, Democrats have fluctuated between holding roughly 4 to 8 congressional seats, depending on election cycles and redistricting.
Democratic Governors Since 1990
Ted Strickland (2007–2011)
Total Democratic Governors since 1990: 1
Republican Representation Since 1990
U.S. Senate
Republicans have held the other Senate seat for extended periods, including:
Rob Portman (2011–2023)
U.S. House of Representatives
Republicans have frequently controlled a majority of Ohio’s House delegation, particularly from 2010 onward.
When people search for the most dangerous city in Michigan or the safest place to live in Michigan with over 50,000 residents, they’re usually looking for real data — not opinions. In this in-depth analysis, we break down verified crime statistics, national rankings, safety trends, and political representation to give you a complete picture of how Michigan stacks up locally and nationally.
For this study, we analyzed cities with a minimum population of 50,000 residents.
🔴 Most Dangerous City in Michigan (Population Over 50,000): Detroit
There is no way to discuss crime in Michigan without acknowledging Detroit. Once one of America’s great industrial powerhouses, the Motor City has faced decades of economic strain, population decline, and systemic challenges that directly correlate with crime trends.
📊 Detroit Crime Statistics (Recent FBI & State Data Averages)
Violent crime rate: Approximately 2,000–2,200 incidents per 100,000 residents
Property crime rate: Roughly 3,500–4,000 incidents per 100,000 residents
Total crime rate: Often exceeds 5,500 per 100,000 residents
National average violent crime rate: ~380–400 per 100,000 residents
Detroit’s violent crime rate is multiple times higher than the national average, particularly in categories such as aggravated assault, robbery, and homicide.
🔎 Why Is Detroit So Dangerous?
Several structural factors contribute:
Long-Term Economic Decline Following the contraction of the auto industry and population loss, unemployment and poverty rose significantly.
High Poverty Rate Detroit consistently ranks among large U.S. cities with the highest poverty rates.
Population Loss & Urban Blight Abandoned properties and lower density in certain neighborhoods can correlate with higher crime.
Gang Activity & Drug Markets Law enforcement reports cite persistent gang and narcotics activity in specific areas.
Strained Municipal Resources Bankruptcy in 2013 severely impacted city services, though improvements have occurred since.
🏆 Where Does Detroit Rank Nationally?
In most national analyses of cities over 50,000 residents, Detroit typically ranks within the Top 10–15 most dangerous cities in the United States based on violent crime rates.
In many recent crime comparisons, Detroit ranks approximately:
#7 to #12 among the Top 50 Most Dangerous U.S. Cities
While crime has declined from its peak decades ago, Detroit still remains statistically one of the most crime-impacted large cities in America.
Safest City in Michigan (Population Over 50,000): Sterling Heights
When examining cities above 50,000 residents, Sterling Heights, MI consistently emerges as one of the safest.
📊 Sterling Heights Crime Statistics
Violent crime rate: Approximately 120–180 per 100,000 residents
Property crime rate: Around 1,000–1,400 per 100,000 residents
Total crime rate: Well below state and national averages
Compared to Detroit, Sterling Heights’ violent crime rate is nearly 10–15 times lower.
🔎 Why Is Sterling Heights So Safe?
Strong Median Household Income
Stable Property Values
Community-Oriented Policing
Low Poverty Rate
Well-Funded Schools & Infrastructure
Suburban Planning & Lower Density Crime Hotspots
Sterling Heights benefits from suburban stability, strong tax base support, and lower concentrated poverty levels.
🏆 National Ranking
Among cities over 50,000 residents nationwide, Sterling Heights typically ranks within:
Top 20–30 Safest Cities in the United States
In many safety index comparisons, it falls roughly around:
#18 to #27 in Top 50 Safest U.S. Cities
Where Does Michigan Rank Overall in Safety?
Based on statewide violent crime rates:
Michigan violent crime rate: ~460–480 per 100,000 residents
National average: ~380–400 per 100,000 residents
Michigan generally ranks in the middle tier nationally, often landing around:
#28 to #34 among the Top 50 Safest States
Michigan does not rank among the safest states in America, largely due to elevated crime concentrations in certain urban areas, particularly Detroit and parts of Flint and Saginaw. However, many suburban and rural communities remain extremely safe.
Political Representation in Michigan Since 1990
Politics often enters conversations about crime and governance. Here’s a fact-based breakdown.
Democratic Representation
U.S. Senate
Since 1990, Michigan has elected:
Debbie Stabenow (2001–present)
Gary Peters (2015–present)
Carl Levin (served until 2015)
Democrats have held at least one Michigan U.S. Senate seat continuously since the early 1990s, and both seats since 2001.
U.S. House of Representatives
Michigan’s congressional delegation has fluctuated over time. Since 1990:
Democrats have typically held between 5 and 9 seats depending on election cycles.
In recent Congresses, Democrats have held roughly half of the state’s delegation.
Republicans held at least one Senate seat during portions of the 1990s before Democrats gained long-term control in the early 2000s.
U.S. House of Representatives
Republicans have often held between 6 and 9 seats during stronger GOP cycles, especially during the 2010–2018 period.
Republican Governors Since 1990
John Engler (1991–2003)
Rick Snyder (2011–2019)
Total Republican Governors since 1990: 2
⚖️ Does Michigan Politics Directly Correlate to Crime?
Crime is influenced by numerous variables:
Economic opportunity
Policing strategies
Education levels
Urban density
Poverty rates
Demographics
Housing stability
While political leadership shapes policy direction, crime trends often reflect decades-long socioeconomic shifts rather than a single administration.
Final Takeaway On Michigan’s Safest and Most Dangerous Cities
Michigan presents a tale of two realities.
On one end, Detroit remains one of the most crime-challenged cities in America despite meaningful progress in recent years.
On the other, Sterling Heights demonstrates how strong local governance, stable income levels, and community policing can create one of the safest environments in the state.
Michigan overall sits in the middle of national safety rankings — neither among the safest nor the most dangerous states.
For readers, voters, and families considering relocation, the key insight is this:
Crime in Michigan is highly localized. Your ZIP code matters more than the state average.
Violent crime rate: ~1,500–1,800 per 100,000 residents
Homicide rate: Frequently above 20 per 100,000 in peak years
Property crime rate: ~4,000+ per 100,000
For context, the national violent crime average typically sits around 380–400 per 100,000. That means Little Rock’s violent crime rate can run roughly 4x the national average.
That’s not “lock yourself in a bunker” territory — but it’s definitely “be aware of your surroundings and don’t leave your truck unlocked with a bass boat attached.”
🔎 What Makes Little Rock More Crime-Prone?
Now let’s think like investigators, not alarmists.
1. Concentrated Poverty Pockets
Like many mid-sized Southern capitals, Little Rock has neighborhoods with high poverty and limited economic mobility — a common correlation with elevated violent crime.
2. Gang Activity
Local law enforcement has repeatedly cited gang-related violence as a contributor to homicide spikes.
3. Drug Trafficking Corridors
Arkansas sits near major interstate transport routes. Narcotics distribution plays a role in crime patterns, especially firearm-related offenses.
4. Urban Density Effect
When you put 200,000 people close together, statistically… things happen. More interactions = more conflict potential.
🇺🇸 Where Does Little Rock Rank Nationally?
Based on recent national crime comparisons for cities over 100,000 residents:
Little Rock often ranks between #20 and #35 in the Top 50 Most Dangerous U.S. Cities (violent crime rate basis).
It does not typically land in the Top 10, but it regularly places within the Top 50.
That’s serious — but not Detroit-in-1990 serious.
🟩 The Safest Large City in Arkansas (100,000+): Fayetteville
Fayetteville Population: ~100,000+
Fayetteville clears the 100,000 threshold and consistently posts the lowest violent crime rate among Arkansas cities of that size.
📊 Crime Snapshot
Violent crime rate: ~250–350 per 100,000
Property crime rate: ~2,000–2,500 per 100,000
Homicide rate: Typically very low, often single digits annually
That violent crime rate is at or below the national average.
🔐 What Makes Fayetteville Safer?
Time to put the detective hat back on.
1. University Effect
Fayetteville is home to University of Arkansas.
College towns often have:
Higher education levels
More police presence
Younger demographic
Strong community engagement
2. Economic Stability
Northwest Arkansas has seen major corporate expansion due to proximity to:
Walmart (headquartered in Bentonville)
Tyson Foods
Higher median income correlates with lower violent crime.
3. Urban Planning & Growth
Fayetteville has invested in infrastructure, walkability, and community programs.
Translation: people feel invested in their city.
🇺🇸 Where Does Fayetteville Rank Nationally?
Among cities over 100,000 residents:
Fayetteville does not typically crack the Top 50 Safest Cities nationwide, because many suburban cities post ultra-low rates.
However, it generally ranks in the top 30–40% safest mid-sized cities in the U.S.
It’s not “Mayberry,” but it’s solidly stable.
🗺️ Where Does Arkansas Rank Among U.S. States for Safety?
Arkansas
Arkansas generally ranks between:
#40 and #45 out of 50 states for overall safety (violent crime rate basis).
Why?
Elevated violent crime rates in urban areas
Above-average homicide rate statewide
Property crime slightly above national average
But here’s the nuance:
Arkansas has large rural areas with extremely low crime. The statewide ranking is pulled upward by concentrated urban violence.
It’s not chaos. It’s uneven distribution.
🏛️ Political Representation Since 1990: Democrats vs Republicans in Arkansas
Now let’s examine leadership history — strictly by numbers.
🟦 Democrats Since 1990
U.S. Senate
Since 1990, Democrats held Arkansas Senate seats until 2015.
Notable:
Blanche Lincoln
Mark Pryor
Total Democratic U.S. Senators since 1990: 2
U.S. House of Representatives
From 1990 to roughly 2010, Democrats held multiple House seats.
Since 2014, all Arkansas House seats have been Republican.
Estimated total Democratic House members since 1990: At least 6 different individuals.
Democratic Governors Since 1990
Bill Clinton (Governor until 1992)
Jim Guy Tucker
Mike Beebe
Democratic Governors since 1990: 3
🟥 Republicans Since 1990
U.S. Senate
Since 2015, both Senate seats have been Republican:
Tom Cotton
John Boozman
Republican U.S. Senators since 1990: 2
U.S. House
As of mid-2010s onward: All 4 House seats are Republican.
Total Republican House members since 1990: Approximately 6+ individuals, mostly in recent years.
Republican Governors Since 1990
Mike Huckabee
Asa Hutchinson
Sarah Huckabee Sanders
Republican Governors since 1990: 3
So… Does Politics Explain Crime?
Here’s the prepper truth:
Crime trends are influenced by:
Poverty
Education levels
Policing strategy
Urban density
Drug markets
Economic opportunity
They are not solely dictated by party control.
Arkansas has had both Democratic and Republican leadership during periods of both rising and falling crime.
If it were that simple, I’d be selling a “Vote & Reduce Crime 30% Overnight” survival kit.
Final Survivalist Verdict on Arkansas
If you’re moving to Arkansas:
Want excitement? Research neighborhoods in Little Rock carefully.
Want stability? Fayetteville is your safest large-city bet.
But remember:
Every city has safe pockets and risky pockets.
Even the safest towns have that one gas station you avoid after 11PM.
If you’re the kind of person who keeps a go-bag in the trunk, rotates canned goods like it’s a professional sport, and still appreciates a good punchline — welcome. Today we’re breaking down Utah’s most dangerous city, the safest Utah city with at least 50,000 residents, the Top 5 highest-crime cities, the Top 5 safest cities, how they compare nationally, and where Utah ranks among the safest states. Then we’ll zoom out into politics — because laws, leadership, and public safety tend to hang out together like cousins at a reunion.
Grab your flashlight. Let’s map this out.
The Most Dangerous City in Utah (50,000+ Residents)
Based on the most recent FBI Uniform Crime Reporting (UCR) data and statewide crime summaries, Salt Lake City stands out as the most criminally active large city in Utah (50,000+ residents).
📊 Crime Snapshot – Salt Lake City
Population: ~200,000+
Violent crime rate: Approx. 7–8 per 1,000 residents
Property crime rate: Often 40+ per 1,000 residents
Total crime rate: Significantly higher than Utah’s statewide average
Why Is Salt Lake City More Dangerous?
Now before anyone throws a snowball at me — yes, it’s Utah’s largest city. More people means more opportunity for crime. But population alone doesn’t explain it.
Factors contributing to higher crime rates:
Dense urban core
Higher rates of homelessness and drug-related offenses
Greater nightlife and entertainment districts
Higher concentration of retail theft
Interstate traffic and transient populations
Meet Brooke Homestead: 2025 Female Survival Prepper of the Year & Featured Survival Blogger
Property crime — especially vehicle break-ins and theft — is the biggest driver. Violent crime exists, but Utah overall still ranks relatively low compared to many other states.
If Utah were a backyard barbecue, Salt Lake City is the one cousin who occasionally knocks over the grill. Not malicious — just chaotic.
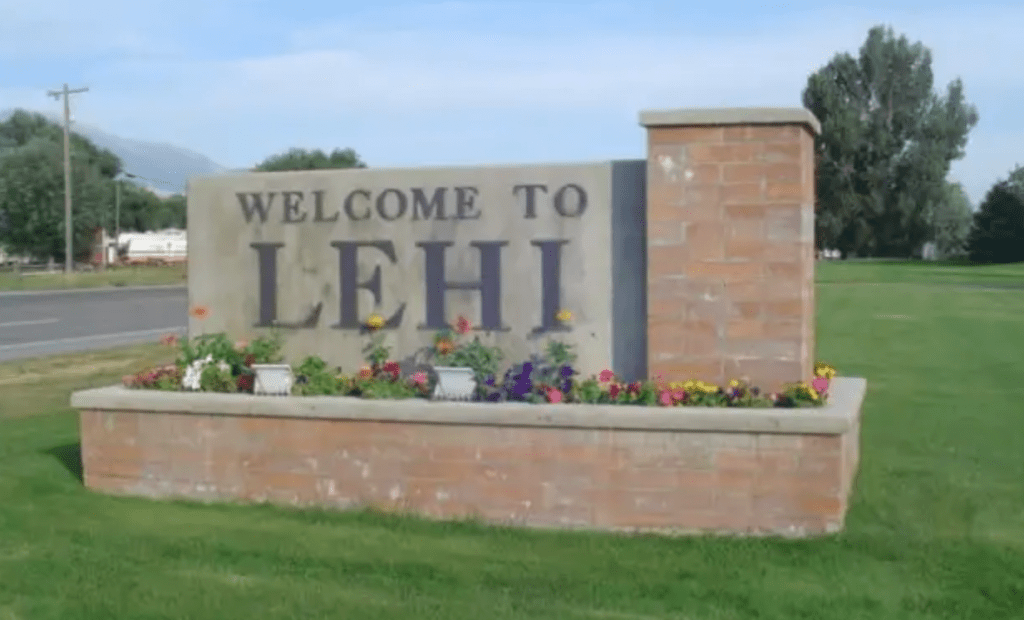
The Safest City in Utah (Minimum 50,000 Residents)
Translation? Stable families, strong economy, low density, and neighbors who notice if you sneeze too loudly after 10 p.m.
If Salt Lake City is a multitool with rough edges, Lehi is the emergency kit that’s color-coded and alphabetized.
🔥 Top 5 Utah Cities With the Most Crime (Overall Volume & Rate)
Regardless of population size:
Salt Lake City
West Valley City
Ogden
South Salt Lake
St. George
Common themes:
Higher density
Regional commerce hubs
Transportation corridors
Retail and tourism activity
Top 5 Safest Utah Cities (Lowest Crime Rates)
Lehi
Herriman
Saratoga Springs
Layton
Bountiful
These cities show:
Strong economic growth
Suburban planning
Lower density
Community policing
In survival terms: fewer variables = fewer problems.
🇺🇸 National Ranking Comparison
Salt Lake City in U.S. Context
Salt Lake City does not rank in the Top 50 most dangerous U.S. cities when compared nationally. Many large metros in other states have significantly higher violent crime rates. Salt Lake City’s crime issues are real — but nationally, it’s mid-tier.
Lehi in U.S. Context
Lehi also does not crack the Top 50 safest U.S. cities, largely due to population thresholds and competition from smaller low-crime towns nationwide. However, among cities of comparable size, it ranks very favorably.
Where Does Utah Rank Among U.S. States for Safety?
Utah consistently ranks in the Top 10 safest states in America for overall crime rates.
Why?
Lower violent crime rates compared to national average
Strong community structures
Lower poverty rates than national average
Cultural emphasis on family/community engagement
Utah is typically ranked between #4 and #8 safest state depending on methodology.
In prepper language: Utah is the well-maintained cabin with solid locks and polite neighbors.
Utah’s Political Representation Since 1990
Let’s zoom out into politics — because public policy influences crime prevention, funding, and enforcement priorities.
U.S. Senate – Utah
Since 1990:
Republicans: 4 individuals have held Senate seats
Democrats: 0 have held a Senate seat since 1990
Utah has been solidly Republican in Senate representation for over three decades.
U.S. House of Representatives – Utah
Utah currently has 4 congressional districts.
Since 1990:
Republicans: Majority representation in nearly all cycles
Democrats: A small number of individual representatives have served briefly, but Republicans have dominated House seats.
Overall trend: Strong Republican majority control in federal House representation.
Governors of Utah Since 1990
Republican Governors:
Norman Bangerter (until 1993)
Mike Leavitt (1993–2003)
Olene Walker (2003–2005)
Jon Huntsman Jr. (2005–2009)
Gary Herbert (2009–2021)
Spencer Cox (2021–present)
Democratic Governors Since 1990:
0
Utah has not had a Democratic governor since before 1990.
Does Politics in Utah Affect Crime?
Correlation is not causation. Crime is influenced by:
Urban density
Economic mobility
Drug markets
Social services
Policing models
Community structure
Utah’s strong economic growth and relatively low poverty likely play larger roles than party affiliation alone.
Still, state leadership shapes:
Sentencing policies
Law enforcement budgets
Criminal justice reforms
Public safety priorities
And if you’re prepping for uncertainty, understanding leadership trends matters.
Utah Is Neither Gotham Nor Mayberry
Utah is not Gotham. It’s not Mayberry either.
Salt Lake City carries the weight of being the state’s urban engine — which naturally brings more crime. Lehi shows what happens when economic growth, suburban planning, and community engagement align.
If you’re evaluating safety — don’t panic. Analyze.
Crime data is a tool. Use it like you’d use a compass: not to scare yourself, but to orient yourself.
And if you’re still worried?
Lock your doors. Know your neighbors. And maybe keep that go-bag stocked — just in case the grill-knocking cousin shows up again.