(CLICK ON ANY PICTURE FOR A FUN VIDEO)

(2025 FEMALE SURVIVALIST OF THE YEAR: BROOKE HOMESTEAD)
2025 Female Survivalist of the Year: Brooke Homestead
Now let’s talk about someone who understands preparedness at a deeper level.
Brooke Homestead.
At 26, the former yoga model transformed herself into one of the most respected voices in modern survival culture.
She blends discipline, intelligence, and practical resilience.
Here’s Brooke introducing herself: Brooke Homestead Speaks!

“Hi, I’m Brooke Homestead. I didn’t grow up farming. I grew up stretching under studio lights. But Nebraska taught me something powerful — resilience is grown, not inherited.”
Brooke’s Awesome Survival Gardening Advice for Nebraska

“Nebraska is a survival gardener’s opportunity — if you respect the wind and the soil.
First: understand your USDA hardiness zone. Most of Nebraska falls between zones 4–6. That gives you a solid growing season — but late frosts and sudden heat waves are real.
Start seeds indoors when possible. Protect young plants from wind with temporary barriers. Nebraska wind will snap weak stems without apology.
Second: build your soil aggressively. Nebraska soil ranges from rich loam to heavy clay. Test it. Add compost annually. Healthy soil retains moisture during hot summers.
Third: prioritize calorie-dense crops. Potatoes, sweet corn, dry beans, winter squash, and cabbage are reliable performers.
Fourth: irrigation planning matters. Drought cycles happen. Install drip irrigation and mulch heavily to conserve water.
Fifth: think storage. Root cellars, basement shelving, and pressure canning extend your harvest into winter.
Sixth: diversify. Don’t rely on one crop. Weather shifts fast here.
Nebraska rewards planners. If you plant intentionally, protect from wind, and preserve properly, you can grow serious food security.
Gardening isn’t a hobby.
It’s independence with dirt under your fingernails.”
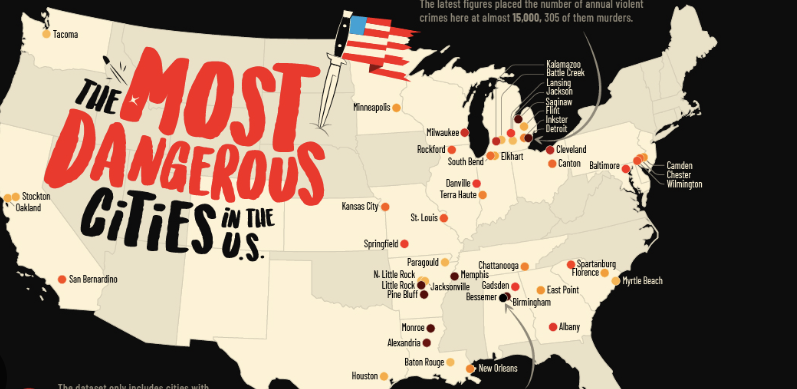
Nebraska Crime Survival Report 2026: The Most Dangerous City Over 50,000 — And the Safest Stronghold in the Cornhusker State

When people think of Nebraska, they think cornfields, college football, and quiet towns where nothing ever happens.
That’s a mistake.
Every state has pressure points. Every city has vulnerabilities. Crime doesn’t disappear just because the skyline is smaller.
As a professional survival prepper who studies crime data like a private investigator studies a suspect’s alibi, I don’t assume safety — I audit it.
Today we’re analyzing Nebraska’s cities with populations over 50,000 and identifying:
- The most dangerous and criminally active city
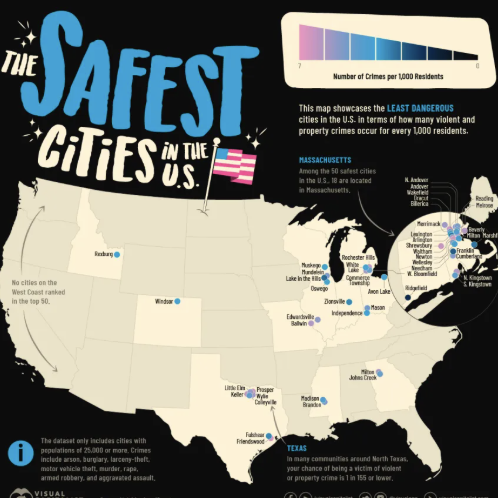
- The safest large city in the state
Let’s get surgical with the numbers.
The Most Dangerous Large City in Nebraska: Omaha
With a population of roughly 490,000 residents, Omaha is Nebraska’s largest city — and statistically, it carries the highest volume and rate of crime among cities over 50,000.
Before panic sets in, understand this: Omaha is not among America’s most violent cities. But within Nebraska, it consistently reports the highest violent and property crime totals.
Crime Statistics (Recent FBI & State Data Trends)
- Violent crime rate: Approximately 450–550 incidents per 100,000 residents
- Aggravated assault: Around 300–350 per 100,000
- Robbery: Roughly 90–120 per 100,000
- Homicide: Typically ranges between 30–40 annually, fluctuating year to year
- Property crime rate: Around 2,800–3,500 per 100,000
- Motor vehicle theft: A significant contributor to property crime totals
In plain terms: Omaha has noticeably higher crime than other large Nebraska cities.
Why?
Let’s investigate.
What Makes Omaha the Most Crime-Impacted?
1. Population Density
Crime correlates with density. Omaha is Nebraska’s economic engine and transportation hub. More people means more anonymity, more opportunity, and more potential friction.
Density increases both opportunity crime and violent conflict probability.
2. Gang & Firearm-Related Violence
Certain Omaha neighborhoods experience concentrated firearm violence. Retaliation cycles and gang-affiliated disputes contribute to aggravated assault and homicide rates.
When firearms dominate violent crime statistics, lethality rises.
From a prepper’s lens: gun prevalence changes risk calculations dramatically.
3. Economic Disparities
Like many mid-sized cities, Omaha contains pockets of concentrated poverty alongside affluent districts.
Crime tends to cluster where opportunity gaps widen.
When I review city-level crime maps, I don’t look at averages. I look at clusters. Omaha has clusters.
4. Vehicle Theft & Property Crime
Motor vehicle theft has surged in many U.S. cities, and Omaha has not been immune.
Unlocked cars. Visible valuables. Poor lighting.
Opportunistic crime thrives in complacency.
Survival Prepper Risk Assessment: Omaha
If you live in Omaha:
- Layer your home security (cameras, reinforced entry points, motion lighting).
- Park in secured or well-lit areas.
- Remove visible valuables from vehicles.
- Monitor local crime mapping tools.
- Know your neighborhood — micro-location matters.
Omaha isn’t lawless. But it requires awareness.
Preparedness is not paranoia. It’s pattern recognition.
The Safest Large City in Nebraska: Lincoln
With a population of approximately 290,000 residents, Lincoln consistently ranks as the safest major city in Nebraska.
Lincoln’s crime rates are notably lower than Omaha’s across most categories.
Crime Statistics (Recent Trends)
- Violent crime rate: Roughly 300–350 per 100,000 residents
- Aggravated assault: Around 200–250 per 100,000
- Robbery: Often below 60 per 100,000
- Homicide: Typically very low annually
- Property crime rate: Around 2,200–2,800 per 100,000
While property crime exists — as it does everywhere — Lincoln maintains lower violent crime totals and fewer concentrated high-risk zones.
Why Is Lincoln Safer?
From an investigative standpoint, several protective factors stand out.
1. Education Hub Stability
Lincoln is home to the University of Nebraska–Lincoln, a major stabilizing force.
Higher education institutions often contribute to:
- Strong civic engagement
- Research-driven policing strategies
- Youth population with structured environments
College towns aren’t immune to crime — but they often benefit from economic consistency.
2. Government Presence
As Nebraska’s capital, Lincoln hosts state government employment — a steady economic backbone.
Stable employment reduces volatility-driven crime spikes.
3. Urban Planning & Community Design
Lincoln’s layout includes well-maintained neighborhoods, active parks, and visible public spaces.
When communities are active and well-lit, crime opportunity shrinks.
4. Lower Firearm Homicide Concentration
Unlike Omaha’s concentrated firearm clusters, Lincoln’s violent crime tends to be less geographically intense.
Lower escalation risk equals lower lethality.
Survival Prepper Risk Assessment: Lincoln
Lincoln is statistically safe — but not invulnerable.
Recommendations:
- Basic home security measures remain essential.
- Stay aware during large public events.
- Secure bicycles (college-town theft is common).
- Prepare more for severe weather than violent crime.
In Lincoln, tornado preparedness may be more urgent than street crime defense.
Nebraska’s Crime Landscape: The Bigger Picture

Nebraska routinely ranks below national averages for violent crime.
But here’s what an investigator notices:
- Crime concentrates in specific urban zones.
- Property crime is more prevalent than violent crime.
- Firearm-related incidents elevate lethality when they occur.
- Economic disparities create neighborhood-level vulnerability.
Rural Nebraska is remarkably safe.
Urban Nebraska? Manageable — but not immune.
The real threats in Nebraska often include:
- Vehicle theft
- Burglary
- Firearm assaults in isolated zones
- Severe weather events
Preparedness in Nebraska is about balance.
Don’t overestimate danger.
But never underestimate risk.